|
Expansion of Hong Kong International Airport into a Three-Runway System |
|
|
|
Construction Phase
Quarterly EM&A Report No.23 (1 July to 30 September 2021) |
|
|
November 2021 |
Contents
1.4 Contact information for the Project
1.5 Summary of Construction Works
1.6 Summary of EM&A Programme Requirements
2 Environmental Monitoring and Auditing
2.1.2 Summary of Monitoring Results
2.2.2 Summary of Monitoring Results
2.3.2 Summary of Monitoring Results
2.4.2 Summary of Monitoring Results
2.4.3 Marine Sediment Management
2.5 Chinese White Dolphin Monitoring
2.5.2 Summary of Monitoring Results
2.6.1 Brief Summary of the Agreed Method
2.6.2 Desk-Based Monitoring Result
2.7 Environmental Site Inspection
2.7.1 Landscape and Visual Mitigation Measures
2.7.2 Land Contamination Assessment
2.8 Audit of SkyPier High Speed Ferries
2.9 Audit of Construction and Associated Vessels
2.10 Review of the Key Assumptions Adopted in the EIA Report
3 Report on Non-compliance, Complaints, Notifications of Summons and Prosecutions
3.1 Compliance with Other Statutory Environmental Requirements
3.2 Analysis and Interpretation of Complaints, Notification of Summons and Status of Prosecutions
3.2.2 Notifications of Summons or Status of Prosecution
4 Conclusion and Recommendation
Tables
Table 1.1: Contact Information of Key Personnel
Table 1.2: Contact Information of the Project
Table 1.3: Summary of Status for All Environmental Aspects under the Updated EM&A Manual
Table 2.1: Impact Air Quality Monitoring Stations
Table 2.2: Percentage of Air Quality Monitoring Results within Action and Limit Levels
Table 2.3: General Meteorological Condition during Impact Air Quality Monitoring
Table 2.4: Impact Noise Monitoring Stations
Table 2.5: Percentage of Noise Monitoring Results within Action and Limit Levels
Table 2.6: General Meteorological Condition during Impact Noise Monitoring
Table 2.7: Monitoring Locations and Parameters for Impact Water Quality Monitoring
Table 2.8: Action and Limit Levels for General Water Quality Monitoring
Table 2.10: Percentage of Water Quality Monitoring Results within Action and Limit Levels
Table 2.11: General Weather Condition and Sea Condition during Impact Water Quality Monitoring
Table 2.12: Summary of DO (Surface and Middle) Compliance Status (Mid-Ebb Tide)
Table 2.13: Summary of DO (Bottom) Compliance Status (Mid-Ebb Tide)
Table 2.14: Summary of DO (Surface and Middle) Compliance Status (Mid-Flood Tide)
Table 2.15: Summary of SS Compliance Status (Mid-Ebb Tide)
Table 2.16: Summary of SS Compliance Status (Mid-Flood Tide)
Table 2.17: Action and Limit Levels for Construction Waste
Table 2.18: Construction Waste Statistics
Table 2.19: Land-based Theodolite Tracking Survey Station Details
Table 2.20: Derived Values of Action Level and Limit Level for Chinese White Dolphin Monitoring
Table 2.23: Summary of Photo Identification
Table 2.24: Summary of Survey Effort and CWD Group of Land-based Theodolite Tracking Survey
Table 2.25: Landscape and Visual – Construction Phase Audit Summary
Table 2.27: Summary of the Tree Status Updated in the Reporting Period
Table 2.28: Summary of the Transplanted Trees Updated in the Reporting Period 37
Table 2.29: Photos of the Existing Transplanted Trees in the Reporting Period
Table 3.1: Summary of Environmental Complaints
Table 3.2: Statistics for Valid Exceedances for the Environmental Monitoring
Table 3.3: Statistics for Non-compliance, Complaints, Notifications of Summons and Prosecution
Figures
Appendices
|
Environmental Mitigation Implementation Schedule (EMIS) for Construction Phase |
|
Abbreviations
|
3RS |
Three-Runway System |
|
AAHK |
Airport Authority Hong Kong |
|
AECOM |
AECOM Asia Company Limited |
|
AFCD |
Agriculture, Fisheries and Conservation Department |
|
AIS |
Automatic Information System |
|
ANI |
Encounter Rate of Number of Dolphins |
|
APM |
Automated People Mover |
|
AW |
Airport West |
|
BHS |
Baggage Handling System |
|
C&D |
Construction and Demolition |
|
CAP |
Contamination Assessment Plan |
|
CAR |
Contamination Assessment Report |
|
CTCC |
Construction Traffic Control Centre |
|
CWD |
Chinese White Dolphin |
|
DCM |
Deep Cement Mixing |
|
DEZ |
Dolphin Exclusion Zone |
|
DO |
Dissolved Oxygen |
|
EIA |
Environmental Impact Assessment |
|
EM&A |
Environmental Monitoring & Audit |
|
EMIS |
Environmental Mitigation Implementation Schedule |
|
EP |
Environmental Permit |
|
EPD |
Environmental Protection Department |
|
EPSS |
Emergency Power Supply Systems |
|
ET |
Environmental Team |
|
FCZ |
Fish Culture Zone |
|
HKBCF |
Hong Kong-Zhuhai-Macao Bridge Hong Kong Boundary Crossing Facilities |
|
HKIA |
Hong Kong International Airport |
|
HSF |
High Speed Ferry |
|
IEC |
Independent Environmental Checker |
|
LKC |
Lung Kwu Chau |
|
MMHK |
Mott MacDonald Hong Kong Limited |
|
MMWP |
Marine Mammal Watching Plan |
|
MSS |
Maritime Surveillance System |
|
MTRMP-CAV |
Updated Marine Travel Routes and Management Plan for Construction and Associated Vessel |
|
NEL |
Northeast Lantau |
|
NWL |
Northwest Lantau |
|
PAM |
Passive Acoustic Monitoring |
|
SC |
Sha Chau |
|
SCZ |
Speed Control Zone |
|
SCLKCMP |
Sha Chau and Lung Kwu Chau Marine Park |
|
SS |
Suspended Solids |
|
STG |
Encounter Rate of Number of Dolphin Sightings |
|
SWL |
Southwest Lantau |
|
T2 |
Terminal 2 |
|
The Manual |
The Updated EM&A Manual |
|
The Project |
The Expansion of Hong Kong International Airport into a Three-Runway System |
|
The SkyPier Plan |
Marine Travel Routes and Management Plan for High Speed Ferries of SkyPier |
|
TSP |
Total Suspended Particulates |
|
WL |
West Lantau |
|
WMP |
Waste Management Plan |
The “Expansion of Hong Kong International Airport into a Three-Runway System” (the Project) serves to meet the future air traffic demands at Hong Kong International Airport (HKIA). On 7 November 2014, the Environmental Impact Assessment (EIA) Report (Register No.: AEIAR-185/2014) for the Project was approved and an Environmental Permit (EP) (Permit No.: EP-489/2014) was issued for the construction and operation of the Project.
Airport Authority Hong Kong (AAHK) commissioned Mott MacDonald Hong Kong Limited (MMHK) to undertake the role of Environmental Team (ET) for carrying out the Environmental Monitoring & Audit (EM&A) works during the construction phase of the Project in accordance with the Updated EM&A Manual (the Manual).
This is the 23rd Construction Phase Quarterly EM&A Report for the Project which summarises the monitoring results and audit findings of the EM&A programme during the reporting period from 1 July 2021 to 30 September 2021.
Key Activities in the Reporting Period
EM&A Activities Conducted in the Reporting Period
The EM&A programme was undertaken in accordance with the Manual of the Project. Summary of the monitoring activities during this reporting period is presented as below:
|
Monitoring Activities |
Number of Sessions |
|
1-hour Total Suspended Particulates (TSP) air quality monitoring |
90 |
|
Noise monitoring |
54 |
|
Water quality monitoring |
39 |
|
Vessel line-transect surveys for Chinese White Dolphin (CWD) monitoring |
6 |
|
Land-based theodolite tracking survey effort for CWD monitoring |
6 |
Environmental auditing works, including weekly site inspections of construction works conducted by the ET and bi-weekly site inspections conducted by the Independent Environmental Checker (IEC), audit of SkyPier High Speed Ferries (HSF), audit of construction and associated vessels, and audit of implementation of Marine Mammal Watching Plan (MMWP) and Dolphin Exclusion Zone (DEZ) Plan, were conducted in the reporting period. Based on information including ET’s observations, records of Maritime Surveillance System (MSS), and contractors’ site records, it is noted that environmental pollution control and mitigation measures were properly implemented and construction activities of the Project in the reporting period did not introduce adverse impacts to the sensitive receivers.
In accordance with Section 6.2.1.1 of the Manual, the methodology of annual sewage flow monitoring for the existing gravity sewer from the airport discharge manhole to Tung Chung Sewage Pumping Station (TCSPS) should be prepared and submitted to EPD one year before the scheduled commencement of operation of the proposed third runway. As such, the sewage flow monitoring methodology paper was prepared, submitted and subsequently approved by EPD on 21 June 2021. The annual sewage flow monitoring has also been started since June 2021. According to the daily flow monitoring record of Sewage Pumping Station 1 (SPS-1) located at the Airport from July to September 2021 (see Appendix C), the daily average flow of 13,989 m3/day for July 2021, 14,335 m3/day for August 2021 and 13,448 m3/day for September 2021 were well below 80% of pipe full flow capacity of 53,395.2 m3/day as defined in Section 2.6.3 of the approved sewage flow monitoring methodology paper. For the subsequent sets of sewage flow monitoring data for SPS-1, it will be presented in upcoming Quarterly and Annual EM&A Reports.
Snapshots of Good Environmental Practices in the Reporting Period
|
|
|
|
|
Use of automated water sprinklers with timers for dust suppression purpose |
Use of solar lighting systems for energy saving and lighting purpose |
Use of silt curtain for marine bored piling works of the approach lights |

Key examples of good site practices implemented in the Project are highlighted as below:
1. Automated water sprinklers system with timers were installed and implemented within the construction site to suppress potential fugitive dust emission.
2. Solar lighting systems were installed at construction site to minimise energy consumption and provide safe and convenient lighting environment for workers and construction vehicular drivers.
3. Silt curtain was deployed in order to minimise potential water quality impact caused by the release of sediment plume during marine bored pilling works of the approach lights.
Summary Findings of the EM&A Programme
The monitoring works for construction dust, construction noise, water quality, construction waste, landscape & visual, and CWD were conducted during the reporting period in accordance with the Manual.
Monitoring results of construction dust, construction noise, construction waste, and CWD monitoring did not trigger the corresponding Action and Limit Levels in the reporting period.
The water quality monitoring results for all parameters, except dissolved oxygen (DO) and suspended solids (SS), obtained during the reporting period were within the corresponding Action and Limit Levels stipulated in the EM&A programme. Relevant investigation and follow-up actions will be conducted according to the EM&A programme if the corresponding Action and Limit Levels are triggered. For DO and SS, some testing results triggered the relevant Action or Limit Levels, and the corresponding investigations were conducted accordingly. The investigation findings concluded that the cases were not related to the Project. To conclude, the construction activities in the reporting period did not introduce adverse impact to all water quality sensitive receivers.
The key findings of the EM&A programme during the reporting period are summarised as below:
|
|
Yes |
No |
Details |
Analysis / Recommendation / Remedial Actions |
|
Breach of Limit Level^ |
|
√ |
No breach of Limit Level was recorded. |
Nil |
|
Breach of Action Level^ |
|
√ |
No breach of Action Level was recorded. |
Nil |
|
Complaints Received |
√ |
|
A complaint regarding dust issue at 3RS construction site area was received on 13 July 2021. |
ET requested the relevant contractor to provide information related to the complaint. During regular site inspections, fugitive dust from vehicular movement and slightly dry haul road were observed in the concerned location, and were followed up by the contractor afterwards. The contractor conducted water spraying according to their dust control management plan and no dust issue was observed at the concerned location during ad-hoc inspections. The contractor was reminded to continue implementing their environmental mitigation measures on dust control on haul road and stockpiles especially on sunny days. The case was considered closed. |
|
Notification of any summons and status of prosecutions |
|
√ |
No notification of summons nor prosecution were received. |
Nil |
|
Changes that affect the EM&A |
|
√ |
There was no change to the construction works that may affect the EM&A. |
Nil |
Remarks:
^Only triggering of Action or Limit Level found related to Project works is counted as Breach of Action or Limit Level.
1
Introduction
1.1
Background
On 7 November 2014, the Environmental Impact Assessment (EIA) Report (Register No.: AEIAR-185/2014) for the “Expansion of Hong Kong International Airport into a Three-Runway System” (the Project) was approved and an Environmental Permit (EP) (Permit No.: EP-489/2014) was issued for the construction and operation of the Project.
Airport Authority Hong Kong (AAHK) commissioned Mott MacDonald Hong Kong Limited (MMHK) to undertake the role of Environmental Team (ET) for carrying out the Environmental Monitoring & Audit (EM&A) works during the construction phase of the Project in accordance with the Updated EM&A Manual (the Manual) submitted under EP Condition 3.1[1]. AECOM Asia Company Limited (AECOM) was employed by AAHK as the Independent Environmental Checker (IEC) for the Project.
The Project covers the expansion of the existing airport into a three-runway system (3RS) with key project components comprising land formation of about 650 ha and all associated facilities and infrastructure including taxiways, aprons, aircraft stands, a passenger concourse, an expanded Terminal 2, all related airside and landside works and associated ancillary and supporting facilities. The submarine aviation fuel pipelines and submarine power cables also require diversion as part of the works.
Construction of the Project is to proceed in the general order of diversion of the submarine aviation fuel pipelines, diversion of the submarine power cables, land formation, and construction of infrastructure, followed by construction of superstructures.
The summary of construction works programme can be referred to the corresponding Monthly EM&A Reports. Description of relevant contracts in the reporting period was presented in Appendix A of the Construction Phase Monthly EM&A Report No. 69.
1.2
Scope of this Report
This is the 23rd Construction Phase Quarterly EM&A Report for the Project which summarises the key findings of the EM&A programme during the reporting period from 1 July 2021 to 30 September 2021.
1.3
Project Organisation
The Project’s organisation structure is provided in Appendix A. Contact details of the key personnel have been updated and provided in Table 1.1.
Table 1.1: Contact Information of Key Personnel
|
Party |
Position |
Name |
Telephone |
|
Project Manager’s Representative (Airport Authority Hong Kong) |
Principal Manager, Environmental Compliance, Sustainability |
Lawrence Tsui |
2183 2734 |
|
Environmental Team (ET) (Mott MacDonald Hong Kong Limited) |
Environmental Team Leader |
Terence Kong |
2828 5919 |
|
Deputy Environmental Team Leader |
Heidi Yu |
2828 5704 |
|
|
Independent Environmental Checker (IEC) (AECOM Asia Company Limited) |
Independent Environmental Checker |
Jackel Law |
3922 9376
|
|
Deputy Independent Environmental Checker |
Roy Man |
3922 9141
|
Reclamation Works:
|
Party |
Position |
Name |
Telephone |
|
Contract 3206 Main Reclamation Works (ZHEC-CCCC-CDC Joint Venture) |
Project Manager |
Alan Mong |
3763 1352
|
|
Environmental Officer |
Zhang Bin Wang |
3763 1451 |
Airfield Works:
|
Party |
Position |
Name |
Telephone |
|
Contract 3301 North Runway Crossover Taxiway (FJT-CHEC-ZHEC Joint Venture) |
Deputy Project Director |
Kin Hang Chung |
9800 0048 |
|
Environmental Officer |
Joe Wong |
6182 0351 |
|
|
Contract 3302 Eastern Vehicular Tunnel Advance Works (China Road and Bridge Corporation) |
Project Manager |
Dickey Yau |
5699 4503 |
|
Environmental Officer |
Dennis Ho |
5645 0563 |
|
|
Contract 3303 Third Runway and Associated Works (SAPR Joint Venture) |
Project Manager |
Andrew Keung |
6277 6628 |
|
Environmental Officer |
Max Chin |
6447 5707 |
|
|
Contract 3305 Airfield Ground Lighting System (ADB Safegate Hong Kong Limited) |
Project Manager |
Allam Al-Turk |
2944 9725 |
|
Environmental Officer |
Calvin Sze |
9205 9277 |
|
|
Contract 3307 Fire Training Facility (Paul Y. Construction Company Limited) |
Project Manager |
Steven Meredith |
6109 1813 |
|
Environmental Officer |
Albert Chan |
9700 1083 |
|
|
Contract 3308 Foreign Object Debris Detection System (DAS Aviation Services Group)
|
Project Manager |
Jeffrey Yau |
9873 7422 |
|
Environmental Officer |
Terry Siu |
9141 2511 |
|
|
Contract 3310 North Runway Modification Works |
Project Manager |
Kingsley Chiang |
9424 8437 |
|
Environmental Officer |
Federick Wong |
9842 2703 |
Third Runway Concourse:
|
Party |
Position |
Name |
Telephone |
|
Contract 3402 New Integrated Airport Centres Enabling Works (Wing Hing Construction Co., Ltd.) |
Contract Manager |
Michael Kan |
9206 0550 |
|
Environmental Officer |
Lisa He |
5374 3418 |
|
|
Contract 3403 New Integrated Airport Centres Building and Civil Works (Sun Fook Kong Construction Limited) |
Project Manager |
Alice Leung |
9220 3162 |
|
Environmental Officer |
Ray Cheung |
9785 1566 |
|
|
Contract 3405 Third Runway Concourse Foundation and Substructure Works (China Road and Bridge Corporation – Bachy Soletanche Group Limited – LT Sambo Co., Ltd. Joint Venture) |
Project Manager |
Francis Choi |
9423 3469 |
|
Environmental Officer |
Jacky Lai |
9028 8975 |
|
|
Contract 3408 Third Runway Concourse and Apron Works (Beijing Urban Construction Group Company Limited and Chevalier (Construction) Company Limited Joint Venture) |
Assistant Project Manager |
Qian Zhang |
5377 7976 |
|
Environmental Officer |
Malcolm Leung |
7073 7559 |
Terminal 2 (T2) Expansion:
|
Party |
Position |
Name |
Telephone |
|
Contract 3503 Terminal 2 Foundation and Substructure Works (Leighton – Chun Wo Joint Venture) |
Project Manager |
Eric Wu |
3973 1718 |
|
Environmental Officer |
Rex Yiu |
6465 6861 |
|
|
ontract 3508 Terminal 2 Expansion Works (Gammon Engineering & Construction Company Limited) |
Project Director |
Richard Ellis |
6201 5637 |
|
Environmental Officer |
Fanny Law |
6184 4650 |
Automated People Mover (APM) and Baggage Handling System (BHS):
|
Party |
Position |
Name |
Telephone |
|
Contract 3601 New Automated People Mover System (TRC Line) (CRRC Puzhen Bombardier Transportation Systems Limited and CRRC Nanjing Puzhen Co., Ltd. Joint Venture) |
Project Manager |
Hongdan Wei |
158 6180 9450 |
|
Environmental Officer
|
P L Wong
|
9143 2185 |
|
|
Contract 3602 Existing APM System Modification Works (Niigata Transys Co., Ltd.) |
Project Manager |
Kunihiro Tatecho |
9755 0351 |
|
Environmental Officer |
Carrie Kwan |
9276 0551 |
|
|
Contract 3603 3RS Baggage Handling System (VISH Consortium) |
Project Manager |
K C Ho |
9272 9626 |
|
Environmental Officer |
Eric Ha |
9215 3432 |
Construction Support (Facilities):
|
Party |
Position |
Name |
Telephone |
|
Contract 3721 Construction Support Infrastructure Works (China State Construction Engineering (Hong Kong) Ltd.) |
Site Agent |
Thomas Lui |
9011 5340 |
|
Environmental Officer |
Xavier Lam |
9493 2944 |
|
|
Contract 3722 Western Support Area – Construction Support Facilities (Tapbo Construction Company Limited and Konwo Modular House Limited Joint Venture) |
Deputy Project Director |
Philip Kong |
9337 8700 |
|
Environmental Officer |
Eddie Suen
|
6338 8862 |
|
|
Contract 3723 Eastern Support Area – Construction Support Facilities (Tapbo Construction Company Limited and Konwo Modular House Ltd. Joint Venture.) |
Deputy Project Director |
Philip Kong |
9337 8700 |
|
Environmental Officer |
Eddie Suen
|
6338 8862 |
|
|
Contract 3728 Minor Site Works (Shun Yuen Construction Company Lmited) |
Contract Manager |
C K Liu |
9194 8739 |
|
Environmental Officer |
K F Li |
9086 1793 |
Airport Support Infrastructure:
|
Party |
Position |
Name |
Telephone |
|
Contract 3801 APM and BHS Tunnels on Existing Airport Island (China State Construction Engineering (Hong Kong) Ltd.) |
Project Manager |
Kingsley Chiang |
9424 8437 |
|
Environmental Officer |
Eunice Kwok |
9243 1331 |
|
|
Contract 3802 APM and BHS Tunnels and Related Works (Gammon Construction Limited) |
Project Director |
John Adams |
6111 6989 |
|
Environmental Officer |
Phoebe Ng |
9869 1105 |
Construction Support (Services / Licences):
|
Party |
Position |
Name |
Telephone |
|
Contract 3901A Concrete Batching Facility (K. Wah Concrete Company Limited) |
Project Manager |
Benedict Wong |
9553 2806 |
|
Environmental Officer |
C P Fung |
9874 2872 |
|
|
Contract 3901B Concrete Batching Facility (Gammon Construction Limited) |
Senior Project Manager |
Gabriel Chan |
2435 3260 |
|
Environmental Officer |
Rex Wong |
2695 6319 |
1.4
Contact information for the Project
The contact information for the Project is provided in Table 1.2. The public can contact us through the following channels if they have any queries and comments on the environmental monitoring data and project related information.
Table 1.2: Contact Information of the Project
|
Channels |
Contact Information |
|
Hotline |
3908 0354 |
|
|
|
|
Fax |
3747 6050 |
|
Postal Address |
Airport Authority Hong Kong HKIA Tower 1 Sky Plaza Road Hong Kong International Airport Lantau Hong Kong Attn: Environmental Team Leader Mr Terence Kong c/o Mr Lawrence Tsui (TRD) |
1.5
Summary of Construction Works
The key activities of the Project carried out in the reporting period included reclamation works and land-based works. Works in the reclamation areas included marine filling, seawall, site office and facilities construction, together with runway and associated works such as bored piling for approach lights. Land-based works on existing airport island involved mainly airfield works, foundation and substructure work for Terminal 2 expansion, modification and tunnel work for APM and BHS systems, and preparation work for utilities, with activities include site establishment, road and drainage works, cable ducting, demolition of existing facilities, piling, and excavation works. The locations of the key construction activities are presented in Figure 1.1.
1.6
Summary of EM&A Programme Requirements
The status for all environmental aspects is presented in Table 1.3. The EM&A requirements remained unchanged during the reporting period.
Table 1.3: Summary of Status for All Environmental Aspects under the Updated EM&A Manual
|
Parameters |
EM&A Requirements |
Status |
|
Air Quality |
|
|
|
Baseline Monitoring |
At least 14 consecutive days before commencement of construction work |
The baseline air quality monitoring result has been reported in Baseline Monitoring Report and submitted to EPD under EP Condition 3.4. |
|
Impact Monitoring |
At least 3 times every 6 days |
On-going |
|
Noise |
|
|
|
Baseline Monitoring |
Daily for a period of at least two weeks prior to the commencement of construction works |
The baseline noise monitoring result has been reported in Baseline Monitoring Report and submitted to EPD under EP Condition 3.4. |
|
Impact Monitoring |
Weekly |
On-going |
|
Water Quality |
|
|
|
General Baseline Water Quality Monitoring for reclamation, water jetting and field joint works |
Three days per week, at mid-flood and mid-ebb tides, for at least four weeks prior to the commencement of marine works. |
The baseline water quality monitoring result has been reported in Baseline Water Quality Monitoring Report and submitted to EPD under EP Condition 3.4. |
|
General Impact Water Quality Monitoring for reclamation, water jetting and field joint works |
Three days per week, at mid-flood and mid-ebb tides. |
On-going for reclamation works. General impact water quality monitoring for water jetting works was completed on 23 May 2017. |
|
Initial Intensive Deep Cement Mixing (DCM) Water Quality Monitoring |
At least four weeks |
The Initial Intensive DCM Monitoring Report was submitted and approved by EPD in accordance with the Detailed Plan on DCM. |
|
Regular DCM Water Quality Monitoring |
Three times per week until completion of DCM works. |
Due to the completion of all marine-based DCM works within May 2021, regular DCM monitoring was ceased at all monitoring stations starting from 24 June 2021 and would be resumed if there are marine-based DCM works in the coming future. |
|
Sewerage and Sewage Treatment |
||
|
Methodology for carrying out annual sewage flow monitoring for concerned gravity sewer |
Methodology to be prepared and submitted to EPD one year before the scheduled commencement of operation of the proposed third runway. |
The proposed methodology of the annual sewage flow monitoring was approved by EPD. The annual flow monitoring has been started since June 2021. |
|
Details of the routine H2S monitoring system for the sewerage system of 3RS |
Details to be prepared and submitted to EPD at least one year before commencement of the operation of 3RS. |
The details of the routine H2S monitoring system will be prepared and submitted to EPD at least one year before commencement of operation of 3RS. |
|
Waste Management |
|
|
|
Waste Monitoring |
At least weekly |
On-going |
|
Land Contamination |
|
|
|
Supplementary Contamination Assessment Plan (CAP) |
At least 3 months before commencement of any soil remediation works. |
The Supplementary CAP was submitted and approved by EPD under EP condition 2.20. |
|
Contamination Assessment Report (CAR) for Golf Course |
CAR to be submitted for golf course |
The CAR for Golf Course was submitted and accepted by EPD. |
|
|
CAR to be submitted for Terminal 2 Emergency Power Supply Systems
|
The CARs for Terminal 2 Emergency Power Supply Systems were submitted and accepted by EPD. |
|
Terrestrial Ecology |
|
|
|
Pre-construction Egretry Survey Plan |
Once per month in the breeding season between April and July, prior to the commencement of HDD drilling works. |
The Egretry Survey Plan was submitted and approved by EPD under EP Condition 2.14. |
|
Ecological Monitoring |
Monthly monitoring during the HDD construction works period from August to March. |
The terrestrial ecological monitoring at Sheung Sha Chau was completed in January 2019. |
|
Marine Ecology |
|
|
|
Pre-Construction Phase Coral Dive Survey |
Prior to marine construction works |
The Coral Translocation Plan was submitted and approved by EPD under EP Condition 2.12. |
|
Coral Translocation |
- |
The coral translocation was completed on 5 January 2017. |
|
Post-translocation Monitoring |
As per an enhanced monitoring programme based on the Coral Translocation Plan |
The post-translocation monitoring programme according to the Coral Translocation Plan was completed in April 2018. |
|
Chinese White Dolphins (CWD) |
|
|
|
Baseline Monitoring |
6 months of baseline surveys before the commencement of land formation related construction works. Vessel line transect surveys: Two full surveys per month; Land-based theodolite tracking surveys: Two days per month at the Sha Chau station and two days per month at the Lung Kwu Chau station; and Passive Acoustic Monitoring (PAM): For the whole duration of baseline period. |
Baseline CWD results were reported in the CWD Baseline Monitoring Report and submitted to EPD in accordance with EP Condition 3.4. |
|
Impact Monitoring |
Vessel line transect surveys: Two full surveys per month; Land-based theodolite tracking surveys: One day per month at the Sha Chau station and one day per month at the Lung Kwu Chau station; and PAM: For the whole duration for land formation related construction works. |
On-going |
|
Landscape and Visual |
|
|
|
Landscape and Visual Plan |
At least 3 months before the commencement of construction works on the formed land of the Project. |
The Landscape & Visual Plan was submitted and approved by EPD under EP Condition 2.18 |
|
Baseline Monitoring |
One-off survey within the Project site boundary prior to commencement of any construction works |
The baseline landscape & visual monitoring result has been reported in Baseline Monitoring Report and submitted to EPD under EP Condition 3.4. |
|
Impact Monitoring |
Weekly
|
On-going |
|
Environmental Auditing |
|
|
|
Regular site inspection |
Weekly |
On-going |
|
Marine Mammal Watching Plan (MMWP) implementation measures |
Monitor and check |
On-going |
|
Dolphin Exclusion Zone (DEZ) Plan implementation measures |
Monitor and check |
On-going |
|
SkyPier High Speed Ferries (HSF) implementation measures |
Monitor and check |
On-going |
|
Construction and Associated Vessels implementation measures |
Monitor and check |
On-going |
|
Silt Curtain Deployment Plan implementation measures |
Monitor and check |
On-going |
|
Spill Response Plan implementation measures |
Monitor and check |
On-going |
|
Complaint Hotline and Email Channel |
Construction phase |
On-going |
|
Environmental Log Book |
Construction phase |
On-going |
Taking into account the construction works in the reporting period, impact monitoring of air quality, noise, water quality, waste management, landscape & visual, and CWD were carried out in the reporting period.
The EM&A programme also involved weekly site inspections and related auditing conducted by ET for the checking of implementation of required environmental mitigation measures recommended in the approved EIA Report. To promote the environmental awareness and enhance the environmental performance of the contractors, environmental trainings and regular environmental management meetings were conducted during the reporting period which are summarised as below:
● Four skipper trainings provided by ET; and
● Fifty-one environmental management meetings for EM&A review with works contracts.
The EM&A programme has been following the recommendations presented in the approved EIA Report and the Manual. A summary of implementation status of the environmental mitigation measures for the construction phase of the Project during the reporting period is provided in Appendix B.
2
Environmental Monitoring and
Auditing
2.1
Air Quality Monitoring
Impact 1-hour Total Suspended Particulates (TSP) monitoring was conducted three times every six days at two representative monitoring stations during the reporting period. The locations of monitoring stations are described in Table 2.1 and presented in Figure 2.1.
2.1.1
Action and Limit Levels
The Action and Limit Levels of the air quality monitoring stipulated in the EM&A programme for triggering the relevant investigation and follow-up procedures under the programme are provided in Table 2.1 for reference.
Table 2.1: Impact Air Quality Monitoring Stations
|
Monitoring Station |
Location |
Action Level (mg/m3) |
Limit Level (mg/m3) |
|
AR1A |
Man Tung Road Park |
306 |
500 |
|
AR2 |
Village House at Tin Sum |
298 |
2.1.2
Summary of Monitoring Results
The air quality monitoring results in the reporting period are summarised in Table 2.2 and the graphical plot is presented in Appendix C.
Table 2.2: Percentage of Air Quality Monitoring Results within Action and Limit Levels
|
|
AR1A |
AR2 |
|
Jul 2021 |
100% |
100% |
|
Aug 2021 |
100% |
100% |
|
Sep 2021 |
100% |
100% |
|
Overall |
100% |
100% |
|
Note: The percentages are calculated by dividing the number of monitoring results within their corresponding Action and Limit Levels by the total number of monitoring results. |
||
All monitoring results were within their corresponding Action and Limit Levels at all monitoring stations in the reporting period.
General meteorological conditions in the last month of the previous quarter and this reporting period were recorded and summarised in Table 2.3.
Table 2.3: General Meteorological Condition during Impact Air Quality Monitoring
|
|
Weather |
Dominant Wind Direction |
|
Jun 2021 |
Sunny to Cloudy |
Southwest |
|
Jul 2021 |
Sunny to Cloudy |
Southwest |
|
Aug 2021 |
Sunny to Cloudy |
Southwest |
|
Sep 2021 |
Sunny to Cloudy |
Southwest |
2.1.3
Conclusion
No dust emission source was observed at the monitoring stations during the monitoring sessions. As the sensitive receivers were far away from the construction activities, with the implementation of dust control measures, there was no adverse impact at the sensitive receivers attributable to the works of the Project.
2.2
Noise Monitoring
Impact noise monitoring was conducted at four representative monitoring stations once per week during 0700 and 1900 in the reporting period. The locations of monitoring stations are described in Table 2.4 and presented in Figure 2.1.
2.2.1
Action and Limit Levels
The Action and Limit Levels of the noise monitoring stipulated in the EM&A programme for triggering the relevant investigation and follow-up procedures under the programme are provided in Table 2.4 for reference.
Table 2.4: Impact Noise Monitoring Stations
|
Monitoring Station |
Location |
Action Level |
Limit Level |
|
NM1A |
Man Tung Road Park |
When one documented complaint is received from any one of the sensitive receivers |
75 dB(A) |
|
NM4 |
Ching Chung Hau Po Woon Primary School |
65dB(A) / 70 dB(A) (i) |
|
|
NM5 |
Village House in Tin Sum |
75 dB(A) |
|
|
NM6 |
House No. 1, Sha Lo Wan |
75 dB(A) |
|
|
Note: (i) The Limit Level for NM4 is reduced to 70dB(A) for being an educational institution. During school examination period, the Limit Level is further reduced to 65dB(A). |
|||
2.2.2
Summary of Monitoring Results
The noise monitoring results in the reporting period are summarised in Table 2.5 and the graphical plot is presented in Appendix C.
Table 2.5: Percentage of Noise Monitoring Results within Action and Limit Levels
|
|
NM1A |
NM4 |
NM5 |
NM6 |
|
Jul 2021 |
100% |
100% |
100% |
100% |
|
Aug 2021 |
100% |
100% |
100% |
100% |
|
Sep 2021 |
100% |
100% |
100% |
100% |
|
Overall |
100% |
100% |
100% |
100% |
|
Note: The percentages are calculated by dividing the number of monitoring results within their corresponding Action and Limit Levels by the total number of monitoring results. |
||||
No complaints were received from any sensitive receiver that triggered the Action Level.
General meteorological conditions in the last month of the previous quarter and this reporting period were recorded and summarised in Table 2.6.
Table 2.6: General Meteorological Condition during Impact Noise Monitoring
|
|
Weather |
|
Jun 2021 |
Sunny to Cloudy |
|
Jul 2021 |
Sunny to Cloudy |
|
Aug 2021 |
Sunny to Cloudy |
|
Sep 2021 |
Sunny to Cloudy |
2.2.3
Conclusion
Major sources of noise dominating the monitoring stations observed during the construction noise impact monitoring were traffic noise near NM1A, school activities at NM4 and aircraft noise near NM6. As the sensitive receivers were far away from the construction activities, with the implementation of noise control measures, there was no adverse impact at the sensitive receivers attributable to the works of the Project.
2.3
Water Quality Monitoring
During the reporting period, water quality monitoring was conducted three days per week, at mid-flood and mid-ebb tides, at a total of 23 water quality monitoring stations, comprising 12 impact (IM) stations, 8 sensitive receiver (SR) stations, and 3 control (C) stations in the vicinity of the water quality sensitive receivers around the existing airport island in accordance with the Manual. The purpose of water quality monitoring at the IM stations is to promptly capture any potential water quality impacts from the Project before the impacts could become apparent at sensitive receivers (represented by the SR stations). Table 2.7 describes the details of the monitoring stations. Figure 2.2 shows the locations of the monitoring stations.
Table 2.7: Monitoring Locations and Parameters for Impact Water Quality Monitoring
|
Description |
Coordinates Easting Northing |
Parameters |
||
|
|
|
|||
|
C1 |
Control Station |
804247 |
815620 |
General Parameters DO, pH, Temperature, Salinity, Turbidity, SS
|
|
C2 |
Control Station |
806945 |
825682 |
|
|
C3(2) |
Control Station |
817803 |
822109 |
|
|
IM1 |
Impact Station |
807132 |
817949 |
|
|
IM2 |
Impact Station |
806166 |
818163 |
|
|
IM3 |
Impact Station |
805594 |
818784 |
|
|
IM4 |
Impact Station |
804607 |
819725 |
|
|
IM5 |
Impact Station |
804867 |
820735 |
|
|
IM6 |
Impact Station |
805828 |
821060 |
|
|
IM7 |
Impact Station |
806835 |
821349 |
|
|
IM8 |
Impact Station |
808140 |
821830 |
|
|
IM9 |
Impact Station |
808811 |
822094 |
|
|
IM10 |
Impact Station |
809794 |
822385 |
|
|
IM11 |
Impact Station |
811460 |
822057 |
|
|
IM12 |
Impact Station |
812046 |
821459 |
|
|
SR1A(1) |
Hong Kong-Zhuhai-Macao Bridge Hong Kong Boundary Crossing Facilities (HKBCF) Seawater Intake for cooling |
812660
|
819977 |
General Parameters DO, pH, Temperature, Salinity, Turbidity, SS |
|
SR2(2) |
Planned marine park / hard corals at The Brothers / Tai Mo To |
814166 |
821463 |
General Parameters DO, pH, Temperature, Salinity, Turbidity, SS
|
|
SR3 |
Sha Chau and Lung Kwu Chau Marine Park / fishing and spawning grounds in North Lantau |
807571 |
822147 |
General Parameters DO, pH, Temperature, Salinity, Turbidity, SS
|
|
SR4A |
Sha Lo Wan |
807810 |
817189 |
|
|
SR5A |
San Tau Beach SSSI |
810696 |
816593 |
|
|
SR6A(3) |
Tai Ho Bay, Near Tai Ho Stream SSSI |
814739 |
817963 |
|
|
SR7 |
Ma Wan Fish Culture Zone (FCZ) |
823742 |
823636 |
|
|
SR8(4) |
Seawater Intake for cooling at Hong Kong International Airport (East) |
811623 |
820390 |
|
Notes:
(1) With the operation of HKBCF, water quality monitoring at SR1A station was commenced on 25 October 2018.
(2) According to the Baseline Water Quality Monitoring Report, C3 station is not adequately representative as a control station of impact/ SR stations during the flood tide. The control reference has been changed from C3 to SR2 from 1 September 2016 onwards.
(3) As the access to SR6 was obstructed by the construction activities and temporary structures for Tung Chung New Town Extension, the monitoring location has been relocated to SR6A starting from 8 August 2019.
(4) The monitoring location for SR8 is subject to further changes due to silt curtain arrangements and the progressive relocation of this seawater intake.
2.3.1
Action and Limit Levels
The Action and Limit Levels for general water quality monitoring stipulated in the EM&A programme for triggering the relevant investigation and follow-up procedures under the programme are presented in Table 2.8. The control and IM stations during flood tide and ebb tide for general water quality monitoring are presented in Table 2.9.
Table 2.8: Action and Limit Levels for General Water Quality Monitoring
|
Parameters |
Action Level |
Limit Level |
||
|
Action and Limit Levels for general water quality monitoring (excluding SR1A & SR8) |
||||
|
DO in mg/l (Surface, Middle & Bottom) |
Surface and Middle 4.5 mg/l |
Surface and Middle 4.1 mg/l 5 mg/l for Fish Culture Zone (SR7) only |
||
|
Bottom 3.4 mg/l |
Bottom 2.7 mg/l |
|||
|
SS in mg/l |
23 |
or 120% of upstream control station at the same tide of the same day, whichever is higher |
37 |
or 130% of upstream control station at the same tide of the same day, whichever is higher |
|
Turbidity in NTU |
22.6 |
36.1 |
||
|
Action and Limit Levels SR1A |
|
|
|
|
|
SS (mg/l) |
33 |
42 |
||
|
Action and Limit Levels SR8 |
|
|
|
|
|
SS (mg/l) |
52 |
|
60 |
|
Notes:
1. For DO measurement, Action or Limit Level is triggered when monitoring result is lower than the limits.
2. For parameters other than DO, Action or Limit Level of water quality results is triggered when monitoring results is higher than the limits.
3. Depth-averaged results are used unless specified otherwise.
4. In view of the construction programme for marine-based DCM works, regular DCM monitoring was ceased since 24 June 2021 and would be resumed if there are marine-based DCM works in the coming future.
Table 2.9: The Control and Impact Stations during Flood Tide and Ebb Tide for General Water Quality Monitoring
|
Control Station |
Impact Stations |
|
Flood Tide |
|
|
C1 |
IM1, IM2, IM3, IM4, IM5, IM6, IM7, IM8, SR3 |
|
SR21 |
IM7, IM8, IM9, IM10, IM11, IM12, SR1A, SR3, SR4A, SR5A, SR6A, SR8 |
|
Ebb Tide |
|
|
C1 |
SR4A, SR5A, SR6A |
|
C2 |
IM1, IM2, IM3, IM4, IM5, IM6, IM7, IM8, IM9, IM10, IM11, IM12, SR1A, SR2, SR3, SR7, SR8 |
Note:
1. As per findings of Baseline Water Quality Monitoring Report, the control reference has been changed from C3 to SR2 from 1 Sep 2016 onwards.
2.3.2
Summary of Monitoring Results
The summary or results within their corresponding Action and Limit Levels in the reporting period are presented in Table 2.10. The weather and sea conditions in the last month of the previous quarter and this reporting period were recorded and summarised in Table 2.11.
Table 2.10: Percentage of Water Quality Monitoring Results within Action and Limit Levels
|
General Water Quality Monitoring |
||||
|
DO (Surface and Middle) |
DO (Bottom) |
SS |
Turbidity |
|
|
Jul 2021 |
100% (455/455) |
100% (455/455) |
99.4% (504/507) |
100% (455/455) |
|
Aug 2021 |
95.2% (417/438) |
94.5% (414/438) |
100% (488/488) |
100% (438/438) |
|
Sep 2021 |
97.4% (443/455) |
100% (455/455) |
99.6% (505/507) |
100% (455/455) |
|
Overall |
97.6% |
98.2% |
99.7% |
100% |
|
Note: (1) The percentages are calculated by dividing the number of depth-averaged results complying with their corresponding Action and Limit Levels by the total number of depth-averaged results. (2) The number in the bracket under the percentage represents the total number of depth-averaged results complying with their corresponding Action and Limit Levels over the total number of depth-averaged results. |
||||
Table 2.11: General Weather Condition and Sea Condition during Impact Water Quality Monitoring
|
|
Weather |
Sea Condition |
|
Jun 2021 |
Sunny to Rainy |
Calm to Rough |
|
Jul 2021 |
Sunny to Rainy |
Moderate to Rough |
|
Aug 2021 |
Sunny to Rainy |
Calm to Rough |
|
Sep 2021 |
Sunny to Rainy |
Calm to Rough |
The monitoring results for all parameters, except dissolved oxygen (DO) and suspended solid (SS), obtained during the reporting period were within their corresponding Action and Limit Levels stipulated in the EM&A programme. The detailed monitoring results are presented in Appendix C. Relevant investigation and follow-up actions will be conducted according to the EM&A programme if the corresponding Action and Limit Levels are triggered.
For DO and SS, some of the testing results triggered the corresponding Action or Limit Levels in the reporting period, and investigations were conducted accordingly. Summaries of results triggering Action or Limit Levels for DO and SS are presented in Table 2.12 to Table 2.16.
Table 2.12: Summary of DO (Surface and Middle) Compliance Status (Mid-Ebb Tide)
|
IM1 |
IM2 |
IM3 |
IM4 |
IM5 |
IM6 |
IM7 |
IM8 |
IM9 |
IM10 |
IM11 |
IM12 |
SR2 |
SR3 |
SR4A |
SR5A |
SR6A |
SR7 |
|
|
03/08/2021 |
D |
D |
D |
D |
|
|
|
|
|
|
|
|
|
|
D |
|
|
|
|
05/08/2021 |
|
D |
|
|
|
|
|
|
|
|
|
|
|
|
|
|
|
|
|
07/08/2021 |
D |
D |
D |
|
|
|
|
|
|
|
|
|
|
|
D |
|
D |
|
|
10/08/2021 |
|
|
|
D |
|
|
|
|
|
|
|
|
|
|
|
|
D |
|
|
17/08/2021 |
D |
|
D |
|
|
|
|
|
|
|
|
|
|
|
D |
|
|
|
|
31/08/2021 |
|
|
|
|
|
|
|
|
|
|
|
|
|
|
|
|
|
D |
|
02/09/2021 |
|
|
|
|
|
|
|
|
|
|
D |
|
|
|
|
|
|
D |
|
18/09/2021 |
D |
D |
D |
|
|
|
|
|
|
|
|
|
|
|
D |
|
D |
D |
|
No. of result triggering Action or Limit Level |
4 |
4 |
4 |
2 |
0 |
0 |
0 |
0 |
0 |
1 |
1 |
0 |
0 |
1 |
4 |
0 |
3 |
3 |
Table 2.13: Summary of DO (Bottom) Compliance Status (Mid-Ebb Tide)
|
IM1 |
IM2 |
IM3 |
IM4 |
IM5 |
IM6 |
IM7 |
IM8 |
IM9 |
IM10 |
IM11 |
IM12 |
SR2 |
SR3 |
SR4A |
SR5A |
SR6A |
SR7 |
|
|
03/08/2021 |
D |
D |
D |
D |
|
|
|
|
|
|
D |
D |
|
|
D |
|
D |
D |
|
05/08/2021 |
|
D |
D |
|
|
|
|
|
|
|
|
|
|
|
D |
|
|
|
|
07/08/2021 |
D |
D |
D |
D |
|
|
|
|
|
|
|
D |
|
|
D |
|
|
|
|
No. of result triggering Action or Limit Level |
2 |
3 |
3 |
2 |
1 |
1 |
0 |
1 |
1 |
1 |
1 |
2 |
0 |
1 |
3 |
0 |
1 |
1 |
Table 2.14: Summary of DO (Surface and Middle) Compliance Status (Mid-Flood Tide)
|
IM1 |
IM2 |
IM3 |
IM4 |
IM5 |
IM6 |
IM7 |
IM8 |
IM9 |
IM10 |
IM11 |
IM12 |
SR3 |
SR4A |
SR5A |
SR6A |
SR7 |
|
|
10/08/2021 |
|
|
|
|
D |
|
|
|
|
|
|
|
|
|
|
|
|
|
31/08/2021 |
|
|
|
|
|
|
|
|
|
|
|
|
|
|
|
|
|
|
02/09/2021 |
|
|
|
|
|
|
|
|
|
|
|
|
|
|
|
|
|
|
09/09/2021 |
|
|
|
|
|
|
|
|
|
|
|
|
|
|
|
|
|
|
No. of result triggering Action or Limit Level |
0 |
0 |
0 |
0 |
1 |
0 |
0 |
0 |
0 |
0 |
0 |
0 |
0 |
1 |
1 |
0 |
3 |
Table 2.15: Summary of SS Compliance Status (Mid-Ebb Tide)
|
IM1 |
IM2 |
IM3 |
IM4 |
IM5 |
IM6 |
IM7 |
IM8 |
IM9 |
IM10 |
IM11 |
IM12 |
SR1A |
SR2 |
SR3 |
SR4A |
SR5A |
SR6A |
SR7 |
SR8 |
|
|
08/07/2021 |
|
|
|
D |
|
|
|
|
|
|
|
|
|
|
|
|
|
|
|
|
|
No. of result triggering Action or Limit Level |
0 |
0 |
0 |
1 |
0 |
0 |
0 |
0 |
0 |
0 |
0 |
0 |
0 |
0 |
0 |
0 |
0 |
0 |
0 |
0 |
Table 2.16: Summary of SS Compliance Status (Mid-Flood Tide)
|
IM1 |
IM2 |
IM3 |
IM4 |
IM5 |
IM6 |
IM7 |
IM8 |
IM9 |
IM10 |
IM11 |
IM12 |
SR1A |
SR3 |
SR4A |
SR5A |
SR6A |
SR7 |
SR8 |
|
|
08/07/2021 |
|
|
|
|
|
|
|
|
|
|
|
|
|
|
|
|
|
|
|
|
31/07/2021 |
|
|
|
|
|
|
|
|
|
|
|
|
|
|
|
|
|
|
|
|
09/09/2021 |
|
|
|
|
|
|
|
|
|
|
|
|
|
|
|
|
|
|
|
|
No. of result triggering Action or Limit Level |
0 |
1 |
1 |
1 |
0 |
0 |
0 |
0 |
0 |
0 |
0 |
0 |
0 |
0 |
1 |
0 |
0 |
0 |
0 |
Note: The monitoring results compiled with their corresponding Action or Limit Levels are presented in Appendix C.
|
Legend: |
|
|
|
Result within corresponding Action and Limit Levels |
|
|
Result triggered the Action Level at monitoring station located upstream of the Project based on dominant tidal flow |
|
D |
Result triggered the Action Level at monitoring station located downstream of the Project based on dominant tidal flow |
|
|
Result triggered the Limit Level at monitoring station located upstream of the Project based on dominant tidal flow |
|
D |
Result triggered the Limit Level at monitoring station located downstream of the Project based on dominant tidal flow |
|
|
Upstream station with respect to the Project during the respective tide based on dominant tidal flow |
|
|
Downstream station with respect to the Project during the respective tide based on dominant tidal flow |
2.3.3
Conclusion
During the reporting period, it is noted that most of the monitoring results were within their corresponding Action and Limit Levels, while some results triggered the corresponding Action or Limit Levels, and investigations were conducted accordingly. Based on the findings presented in Construction Phase Monthly EM&A Report Nos. 67, 68 and 69, the cases that triggered the corresponding Action or Limit Levels were not related to the Project. Hence, the Project did not introduce adverse impact to all water quality sensitive receivers. All required actions under the Event and Action Plan were followed.
Nevertheless, the non-project related trigger was attended to and initiated corresponding action and measures. As part of the EM&A programme, the construction methods and mitigation measures for water quality will continue to be monitored and opportunities for further enhancement will continue to be explored and implemented where possible, to strive for better protection of water quality and the marine environment.
In the meantime, the contractors were reminded to implement and maintain all mitigation measures during weekly site inspections and regular environmental management meetings. These include maintaining mitigation measures properly for reclamation works including marine filling and seawall construction as recommended in the Manual.
2.4
Waste Monitoring
In accordance with the Manual, waste generated from construction activities was audited once per week to determine if wastes were being managed in accordance with the Waste Management Plan (WMP) prepared for the Project, contract-specific WMP, and any statutory and contractual requirements. All aspects of waste management including waste generation, storage, transportation, and disposal were assessed during the audits.
2.4.1
Action and Limit Levels
The Action and Limit Levels of the construction waste are provided in Table 2.17.
Table 2.17: Action and Limit Levels for Construction Waste
|
Monitoring Stations |
Action Level |
Limit Level |
|
Construction Area |
When one valid documented complaint is received |
Non-compliance of the WMP, contract-specific WMPs, any statutory and contractual requirements |
2.4.2
Summary of Monitoring Results
Weekly monitoring of the Project construction works was carried out by the ET in the reporting period to check and monitor the implementation of proper waste management practices.
Recommendations made by the ET included provision and maintenance of proper chemical waste storage area, as well as handling, segregation, and regular disposal of general refuse. The contractors had taken actions to implement the recommended measures. Waste management audits were carried out by ET according to the requirement of the Waste Management Plan, Updated EM&A Manual and the implementation schedule of the waste management mitigation measures in Appendix B.
Based on updated contractors’ information, summary of construction waste generated in the reporting period is presented in Table 2.18. Proactive measures have been undertaken during the re-configuration of T2 building. The contractor has established the recycling strategy for C&D materials with proper planning and design to maximize recycling and reuse. Dedicated recyclers were employed for different kinds of recyclable materials by the contractor, and ET and IEC have carried out site visits to recyclers’ facilities to review recycling process. Dedicated areas for sorting of materials are established on site. Recyclable materials such as steel, reinforcement bar, structural steel, aluminium, copper, other metals and glass are sorted on-site and transported off-site for recycling. ET and IEC have carried out site audits regularly and reviewed the trip ticket system.
Table 2.18: Construction Waste Statistics
|
|
C&D(1) Material Stockpiled for Reuse or Recycle (m3) |
C&D Material Reused in the Project (m3) |
C&D Material Reused in other Projects (m3) |
C&D Material Transferred to Public Fill(3) (m3) |
Chemical Waste (kg) |
Chemical Waste (l) |
General Refuse (tonne) |
|
Jul 2021(2) |
28,937 |
130,888 |
381 |
4,514 |
0 |
0 |
1,582 |
|
Aug 2021(2) |
17,930 |
94,765 |
464 |
4,059 |
0 |
1,200 |
2,064 |
|
Sep 2021(2) |
13,736 |
72,778 |
294 |
4,178 |
0 |
0 |
1,986 |
|
Total |
60,603 |
298,431 |
1,139 |
12,751 |
0 |
1,200 |
5,632 |
|
Notes: 1. C&D refers to Construction and Demolition. 2. Paper, metals and/or plastics were recycled in the reporting period. 3. C&D materials not suitable for reuse on-site, including asphalt waste and sediment slurry, were transferred to public fill during the reporting period. |
|||||||
There were no complaints, non-compliance of the WMP, contract-specific WMPs, statutory and contractual requirements that triggered Action and Limit Levels in the reporting period.
2.4.3
Marine Sediment Management
Marine sediment is managed according to the EIA Report, Updated EM&A Manual and Waste Management Plan of the Project. The sampling process, storage conditions of the excavated marine sediment, treatment process, final backfilling location as well as associated records were inspected and checked by ET and verified by IEC to ensure they were in compliance with the requirements as stipulated in the Waste Management Plan.
Sampling works for marine sediment generated from the reclaimed land area was on-going during the reporting period. The details of the marine sediment sampling, treatment and backfilling will be reported in the subsequent EM&A Reports upon completion.
2.5
Chinese White Dolphin Monitoring
CWD monitoring was conducted by vessel line transect survey at a frequency of two full surveys per month, supplemented by land-based theodolite tracking survey and PAM. The frequency of the land-based theodolite tracking survey during the construction phase was one day per month at both Sha Chau (SC) and Lung Kwu Chau (LKC) stations, as stipulated in the Manual. The vessel survey transects followed the transect lines proposed in the Manual and are consistent with those used in the Agriculture, Fisheries and Conservation Department (AFCD) long-term CWD monitoring programme. The transect locations of CWD monitoring by vessel line transect survey conducted from July to September 2021 are shown in Figure 2.3, whilst the land-based theodolite tracking survey stations are described in Table 2.19 and depicted in Figure 2.4. The location of the PAM device is shown in Figure 2.10.
Table 2.19: Land-based Theodolite Tracking Survey Station Details
|
Stations |
Location |
Geographical Coordinates |
Station Height (m) |
Approximate Tracking Distance (km) |
|
D |
Sha Chau (SC) |
22° 20’ 43.5” N 113° 53’ 24.66” E |
45.66 |
2 |
|
E |
Lung Kwu Chau (LKC) |
22° 22’ 44.83” N 113° 53’ 0.2” E |
70.40 |
3 |
2.5.1
Action and Limit Levels
The Action Level and Limit Level for CWD monitoring were formulated by an action response approach using the running quarterly dolphin encounter rates (STG and ANI) derived from baseline monitoring data, as presented in the CWD Baseline Monitoring Report. The derived values of Action and Limit Levels for CWD monitoring are shown in Table 2.20.
Table 2.20: Derived Values of Action Level and Limit Level for Chinese White Dolphin Monitoring
|
|
NEL, NWL, AW, WL and SWL as a Whole |
|
Action Level |
Running quarterly STG < 1.86 & ANI < 9.35 |
|
Limit Level |
Two consecutive running quarterly (3-month) STG < 1.86 & ANI < 9.35 |
2.5.2
Summary of Monitoring Results
2.5.2.1
Vessel Line Transect
Survey
Survey Effort
During the July to September 2021 reporting period, a total of six sets of vessel line transect survey covering all transects in Northeast Lantau (NEL), Northwest Lantau (NWL), Airport West (AW), West Lantau (WL) and Southwest Lantau (SWL) survey areas were conducted at a frequency of twice per month, in each survey area.
A total of around 1,328 km of survey effort was collected from these surveys, with around 97.9% of the total survey effort being conducted under favourable weather condition (i.e. Beaufort Sea State 3 or below with favourable visibility). Details of the survey effort data are presented in Appendix C.
CWD Sighting
From July to September 2021, there were a total of 51 sightings of CWDs, with 164 dolphins sighted (Table 2.21). Amongst these sightings, 50 sightings with 161 dolphins were recorded during on-effort searches under favourable weather condition.
When breaking down the sightings by survey areas, nine sightings with 20 dolphins, 29 sightings with 105 dolphins and 13 sightings with 39 dolphins were recorded in NWL, WL and SWL respectively during the current reporting period. No CWD was sighted in NEL survey area.
Compared with the last quarter (i.e. April to June 2021), both the total number of CWD sightings and total number of the dolphins increased drastically by 82% and 105% respectively. These results reflected increases of the dolphin sightings and the number of dolphins in NWL and WL survey areas. The number of sightings and number of dolphins in SWL are similar to those of the last quarter.
Compared with the same quarter of last year (i.e. July to September 2020), there was an increase in terms of the total number of dolphin sighting by 21% but a slight drop in total number of dolphins by 7%. Notably, there are significant increases in both dolphin sighting and number of dolphin in NWL compared with the same period of last year.
Table 2.21 below shows the comparison of the numbers of sightings and dolphins amongst the current reporting period, last quarter, and the same quarter of last year.
Table 2.21: Summary of Number of CWD Sightings and Number of Dolphins for the Same Quarter Last Year, Previous Quarter, and Current Reporting Period
|
|
Same Quarter of Last Year |
Previous Reporting Period |
Current Reporting Period |
|
|
July to September 2020 |
April to June 2021 |
July to September 2021 |
|
NEL |
0 (0) |
0 (0) |
0 (0) |
|
NWL |
1 (2) |
0 (0) |
9 (20) |
|
AW |
0 (0) |
0 (0) |
0 (0) |
|
WL |
24 (124) |
13 (39) |
29 (105) |
|
SWL |
17 (50) |
15 (41) |
13 (39) |
|
Total |
42 (176) |
28 (80) |
51 (164) |
Note: Values in ( ) represent number of dolphins
The distribution of CWD sightings recorded from July to September 2021 is illustrated in Figure 2.5. In NWL, the majority of the CWD sightings were around Lung Kwu Chau, with several sightings scattered in east of Sha Chau and the southwestern part of the survey area. In WL, CWD sightings were quite evenly scattered amongst the entire survey area from Tai O to Fan Lau. In SWL, dolphin sightings were scattered in the central and western parts of the survey area from the Soko Islands to Fan Lau. No CWD sightings were recorded in NEL survey area during the reporting period. Details of the sighting data are presented in Appendix C.
Figure 2.5: Sightings
Distribution of Chinese White Dolphins from July to September 2021
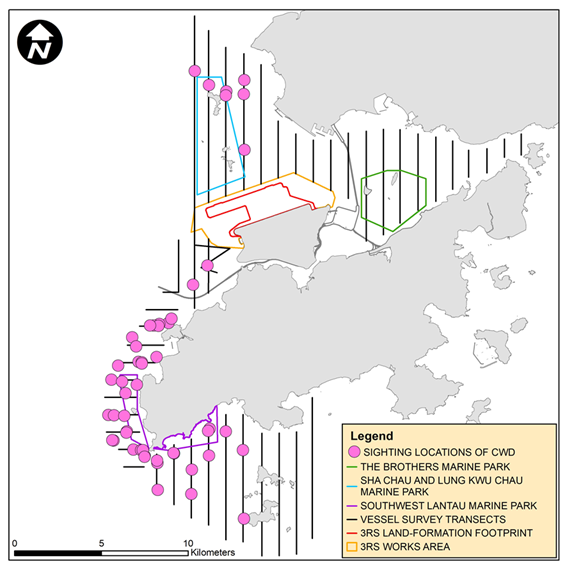
Remarks: (1) Please note that there are 51 pink circles on the map indicating the sighting locations of CWD. Some of them were very close to each other and therefore appear overlapped on this sighting distribution map. (2) Marine park excludes land area and the landward boundary generally follows the high water mark along the coastline.
Encounter Rate
The dolphin encounter rates for the number of on-effort dolphin sightings per 100 km survey effort (STG) and for the total on-effort number of dolphins per 100 km survey effort (ANI) in the whole survey area (i.e. NEL, NWL, AW, WL and SWL) for July, August and September 2021 are summarised in Table 2.22.
In this reporting period, both the monthly STG and ANI decreased from July to August 2021 (STG: from 6.84 to 1.32; ANI: from 21.22 to 4.19), but followed by a rebound in September 2021 (STG: from 1.32 to 3.55; ANI: from 4.19 to 12.29), causing a similar course in running quarterly STG and ANI. No Action Level for CWD monitoring was triggered during the reporting period.
Compared with the previous reporting period (i.e. April to June 2021), the running quarterly STG increased from 2.60 in June 2021 to 3.84 in September 2021 and the running quarterly ANI also increased from 7.51 in June 2021 to 12.38 in September 2021. While comparing with the same quarter of last year (i.e. July to September 2020), the running quarterly STG increased from 3.23 to 3.84 but the running quarterly ANI decreased from 13.23 to 12.38. Encounter rates for these periods are summarised in Table 2.22 and graphical presentation is provided in Appendix C.
Table 2.22: Summary of Monthly and Running Quarterly STG and ANI of Chinese White Dolphin for the Same Quarter Last Year, Previous Quarter, and Current Reporting Period
|
|
Same Quarter of Last Year |
Previous Reporting Period |
Current Reporting Period |
||||||
|
|
Jul 20 |
Aug 20 |
Sep 20 |
Apr 21 |
May 21 |
Jun 21 |
Jul 21 |
Aug 21 |
Sep 21 |
|
Monthly STG |
6.84 |
1.90 |
1.18 |
2.02 |
2.91 |
2.86 |
6.84 |
1.32 |
3.55 |
|
Monthly ANI |
28.62 |
7.59 |
4.48 |
6.65 |
7.68 |
8.25 |
21.22 |
4.19 |
12.29 |
|
Running Quarterly STG |
4.88 |
4.81 |
3.23 |
2.76 |
2.30 |
2.60 |
4.39 |
3.69 |
3.84 |
|
Running Quarterly ANI |
21.16 |
19.01 |
13.23 |
9.13 |
6.19 |
7.51 |
12.98 |
11.32 |
12.38 |
Note: For detailed calculations of encounter rates STG and ANI for the current reporting period, please refer to the Construction Phase Monthly EM&A Report Nos. 67, 68 and 69.
Group Size
Between July and September 2021, the group size of CWD sightings ranged from 1 to 10 dolphins. The average group size of CWDs was 3.22 dolphins per group, which is larger than that of the last quarter (2.86 dolphins per group). The average group size of CWDs in this reporting quarter is smaller than that of the same quarter of last year (4.19 dolphins per group).
In this reporting quarter, the numbers of CWD sightings with small group size (i.e. 1-2 dolphins) and medium group size (i.e. 3-9 dolphins) were similar. There was only one CWD sighting with large group size (i.e. 10 or more dolphins) recorded in this reporting period, which is encountered in WL survey area.
In the current reporting quarter, there are no observable differences in the distribution pattern between small-sized and medium-sized dolphin groups in WL as they all scattered amongst survey area. In SWL, the small groups appeared to distribute closer to the Soko Islands while medium groups appeared closer to Fan Lau. In NWL, medium-sized dolphin groups recorded tend to be clustered around Lung Kwu Chau during the current reporting period. Sighting locations of CWD groups with different group sizes are depicted in Figure 2.6.
Figure 2.6: Sighting Locations of Chinese White Dolphins with Different Group Sizes
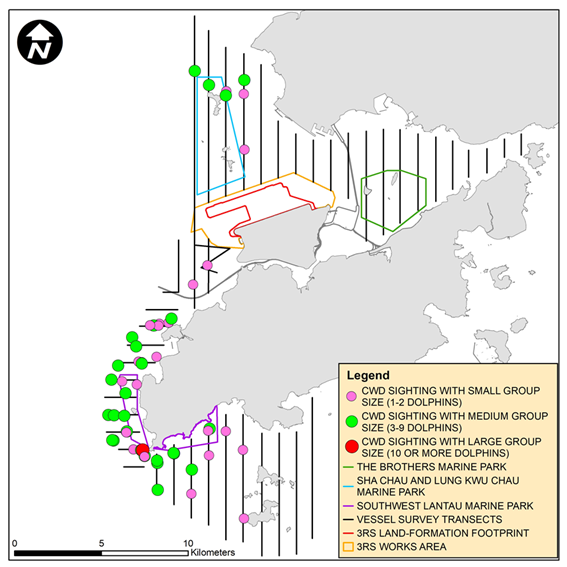
Remarks: (1) Please note that there are 51 circles on the map indicating the sighting locations of CWD. Some of them were very close to each other and therefore appear overlapped on this sighting distribution map. (2) Marine park excludes land area and the landward boundary generally follows the high water mark along the coastline.
Activities and Association with Fishing Boats
From July to September 2021, 14 sightings of CWDs were recorded with feeding activities. Amongst them, five sightings were observed associated with operating purse seiners in WL and SWL survey areas.
The number of sightings with feeding recorded in the current reporting period is much higher than that in the previous reporting period (i.e. six sightings involved feeding activities between April to June 2021). The number of CWD sightings with feeding activities in this reporting period is also higher than that in the same quarter of last year (i.e. 10 sightings between July and September 2020).
The sighting locations of CWDs engaged in different behaviours during the current reporting period are illustrated in Figure 2.7.
Figure 2.7: Sighting Locations of Chinese White Dolphins Engaged in Different Behaviours
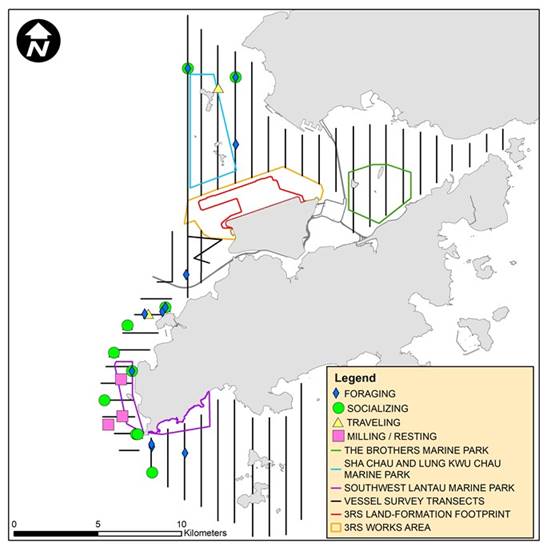
Remarks: Marine park excludes land area and the landward boundary generally follows the high water mark along the coastline.
Mother-calf Pairs
From July to September 2021, seven sightings of CWDs were recorded with the presence of mother-and-unspotted juvenile pairs and/or mother-and-unspotted calf pairs observed, which is similar to that recorded in the previous reporting quarter (i.e. six sightings between April and June 2021). The number of CWD sightings with the presence of mother-calf pairs is lower than that recorded in the same quarter of last year (i.e. 11 sightings between July and September 2020). These six sightings were recorded in WL and SWL.
The locations of CWD sightings with the presence of mother-calf pairs are shown in Figure 2.8.
Figure 2.8: Sighting Locations of Mother-calf Pairs
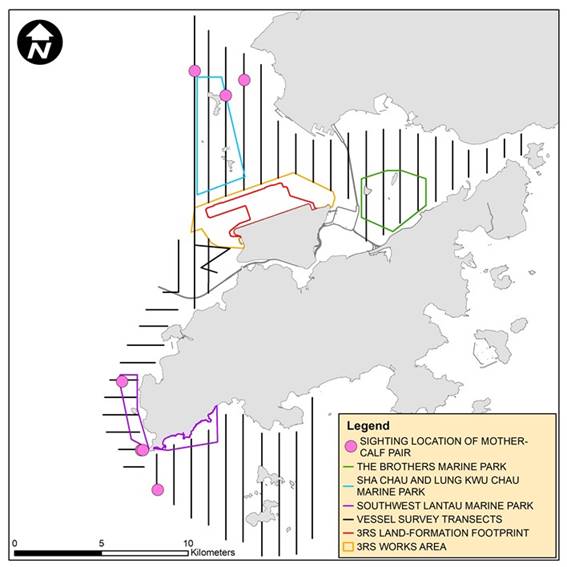
Remarks: (1)
Please note that there are seven circles on the map indicating the sighting
locations of Mother-Calf pair. (2) Marine park excludes land area and the
landward boundary generally follows the high water
mark along the coastline.
Photo Identification
Between July and September 2021, a total number of 54 different CWD individuals were identified altogether for 98 times. Re-sighting information of CWD individuals provides an initial idea of their range use and apparent connection between different areas of Lantau waters. Amongst these 54 different CWD individuals, 26 animals (i.e. NLMM009, NLMM013, NLMM015, SLMM003, SLMM007, SLMM010, SLMM012, SLMM014, SLMM023, SLMM037, SLMM064, SLMM073, WLMM001, WLMM007, WLMM028, WLMM043, WLMM063, WLMM067, WLMM073, WLMM076, WLMM079, WLMM089, WLMM092, WLMM114, WLMM131 and WLMM164) were sighted for more than once.
Fourteen individuals including NLMM015, SLMM007, SLMM012, SLMM014, SLMM023, SLMM037, SLMM064, SLMM073, WLMM001, WLMM007, WLMM067, WLMM073, WLMM114 and WLMM164 were re-sighted in different survey areas (i.e. NWL and WL / WL and SWL) during this reporting period. The most frequently re-sighted individuals in this reporting quarter are NLMM013, NLMM015, SLMM003, SLMM010, SLMM014 and SLMM037 that each of them has been encountered four times. The number of CWD individuals re-sighted more than once and the number of CWD individuals showing cross-area movement in the current reporting period are both higher than those of the previous reporting quarter from April to June 2021 (13 and 5 individuals respectively).
A summary of photo identification works is presented in Table 2.23. Representative photos of the 54 identified individuals and figures depicting the sighting locations of the aforementioned 26 re-sighted individuals recorded in this reporting period are presented in Appendix C.
Table 2.23: Summary of Photo Identification
|
Individual ID |
Date of sighting |
Sighting Group No. |
Area |
|
Individual
|
Date of sighting |
Sighting Group No. |
Area |
|
NLMM001 |
22-Jul-21 |
4 |
WL |
|
SLMM070 |
08-Sep-21 |
3 |
SWL |
|
NLMM009 |
26-Jul-21 |
2 |
NWL |
|
SLMM073 |
08-Sep-21 |
5 |
SWL |
|
|
11-Aug-21 |
1 |
NWL |
|
|
16-Sep-21 |
6 |
WL |
|
|
|
2 |
NWL |
|
WLMM001 |
12-Jul-21 |
4 |
SWL |
|
NLMM013 |
26-Jul-21 |
1 |
NWL |
|
|
22-Jul-21 |
3 |
WL |
|
|
|
2 |
NWL |
|
WLMM004 |
23-Sep-21 |
3 |
WL |
|
|
11-Aug-21 |
3 |
NWL |
|
WLMM007 |
08-Sep-21 |
5 |
SWL |
|
|
20-Sep-21 |
1 |
NWL |
|
|
16-Sep-21 |
6 |
WL |
|
NLMM015 |
26-Jul-21 |
2 |
NWL |
|
WLMM009 |
12-Jul-21 |
6 |
SWL |
|
|
11-Aug-21 |
1 |
NWL |
|
WLMM019 |
20-Sep-21 |
1 |
NWL |
|
|
|
2 |
NWL |
|
WLMM028 |
22-Jul-21 |
7 |
WL |
|
|
18-Aug-21 |
2 |
WL |
|
|
|
9 |
WL |
|
NLMM020 |
18-Aug-21 |
2 |
WL |
|
WLMM029 |
22-Jul-21 |
7 |
WL |
|
NLMM023 |
28-Jul-21 |
3 |
NWL |
|
WLMM030 |
14-Jul-21 |
3 |
WL |
|
NLMM027 |
16-Sep-21 |
6 |
WL |
|
WLMM043 |
14-Jul-21 |
1 |
WL |
|
NLMM061 |
16-Sep-21 |
3 |
WL |
|
|
|
4 |
WL |
|
NLMM063 |
18-Aug-21 |
2 |
WL |
|
|
22-Jul-21 |
1 |
WL |
|
NLMM078 |
22-Jul-21 |
1 |
WL |
|
WLMM056 |
16-Sep-21 |
2 |
WL |
|
SLMM003 |
14-Jul-21 |
2 |
WL |
|
WLMM063 |
22-Jul-21 |
5 |
WL |
|
|
|
7 |
WL |
|
|
23-Sep-21 |
3 |
WL |
|
|
24-Aug-21 |
1 |
WL |
|
WLMM065 |
16-Sep-21 |
3 |
WL |
|
|
16-Sep-21 |
6 |
WL |
|
WLMM067 |
22-Jul-21 |
1 |
WL |
|
SLMM007 |
08-Sep-21 |
5 |
SWL |
|
|
08-Sep-21 |
5 |
SWL |
|
|
16-Sep-21 |
6 |
WL |
|
WLMM073 |
12-Jul-21 |
5 |
SWL |
|
SLMM010 |
14-Jul-21 |
2 |
WL |
|
|
08-Sep-21 |
5 |
SWL |
|
|
22-Jul-21 |
1 |
WL |
|
|
16-Sep-21 |
5 |
WL |
|
|
|
2 |
WL |
|
WLMM076 |
14-Jul-21 |
6 |
WL |
|
|
23-Sep-21 |
2 |
WL |
|
|
22-Jul-21 |
1 |
WL |
|
SLMM012 |
13-Jul-21 |
3 |
SWL |
|
WLMM079 |
18-Aug-21 |
2 |
WL |
|
|
24-Aug-21 |
1 |
WL |
|
|
16-Sep-21 |
6 |
WL |
|
SLMM014 |
12-Jul-21 |
2 |
SWL |
|
WLMM089 |
28-Jul-21 |
1 |
NWL |
|
|
14-Jul-21 |
5 |
WL |
|
|
|
2 |
NWL |
|
|
08-Sep-21 |
2 |
SWL |
|
WLMM091 |
14-Jul-21 |
3 |
WL |
|
|
16-Sep-21 |
6 |
WL |
|
WLMM092 |
14-Jul-21 |
3 |
WL |
|
SLMM022 |
16-Sep-21 |
3 |
WL |
|
|
22-Jul-21 |
6 |
WL |
|
SLMM023 |
13-Jul-21 |
3 |
SWL |
|
WLMM111 |
16-Sep-21 |
3 |
WL |
|
|
16-Sep-21 |
5 |
WL |
|
WLMM114 |
12-Jul-21 |
4 |
SWL |
|
SLMM027 |
13-Jul-21 |
3 |
SWL |
|
|
13-Jul-21 |
3 |
SWL |
|
SLMM029 |
08-Sep-21 |
4 |
SWL |
|
|
23-Sep-21 |
3 |
WL |
|
SLMM034 |
13-Jul-21 |
3 |
SWL |
|
WLMM122 |
22-Jul-21 |
1 |
WL |
|
SLMM045 |
22-Jul-21 |
2 |
WL |
|
WLMM131 |
14-Jul-21 |
6 |
WL |
|
SLMM049 |
13-Jul-21 |
3 |
SWL |
|
|
23-Sep-21 |
2 |
WL |
|
SLMM037 |
12-Jul-21 |
3 |
SWL |
|
WLMM152 |
16-Sep-21 |
3 |
WL |
|
|
13-Jul-21 |
2 |
SWL |
|
WLMM164 |
11-Aug-21 |
1 |
NWL |
|
|
14-Jul-21 |
7 |
WL |
|
|
|
2 |
NWL |
|
|
24-Aug-21 |
1 |
WL |
|
|
18-Aug-21 |
2 |
WL |
|
SLMM060 |
13-Jul-21 |
1 |
SWL |
|
WLMM166 |
22-Jul-21 |
2 |
WL |
|
SLMM064 |
22-Jul-21 |
3 |
WL |
|
WLMM167 |
16-Sep-21 |
6 |
WL |
|
|
08-Sep-21 |
4 |
SWL |
|
|
|
|
|
|
|
16-Sep-21 |
6 |
WL |
|
|
|
|
|
2.5.2.2
Land-based
Theodolite Tracking Survey
Survey Effort
Between July and September 2021, a total of six days of land-based theodolite tracking survey effort were completed, including three days on Lung Kwu Chau and three days on Sha Chau. In total, one CWD group was tracked from the Lung Kwu Chau station while no CWD groups were tracked from the Sha Chau station, with an overall 0.03 CWD groups sighted per survey hour.
Information on survey effort and CWD groups sighted during land-based theodolite tracking surveys are presented in Table 2.24. Details on the survey effort and CWD groups tracked are presented in Appendix C. The first sighting locations of CWD groups tracked between July and September 2021 are shown in Figure 2.9.
Table 2.24: Summary of Survey Effort and CWD Group of Land-based Theodolite Tracking Survey
|
Land-based Station |
# of Survey Sessions |
Survey Effort (hh:mm) |
# CWD Groups Sighted |
CWD Group Sighting per Survey Hour |
|
July 2021 |
||||
|
Lung Kwu Chau |
1 |
06:00 |
1 |
0.17 |
|
Sha Chau |
1 |
06:00 |
0 |
0 |
|
TOTAL |
2 |
12:00 |
1 |
0.08 |
|
August 2021 |
||||
|
Lung Kwu Chau |
1 |
06:00 |
0 |
0 |
|
Sha Chau |
1 |
06:00 |
0 |
0 |
|
TOTAL |
2 |
12:00 |
0 |
0 |
|
September 2021 |
||||
|
Lung Kwu Chau |
1 |
06:00 |
0 |
0 |
|
Sha Chau |
1 |
06:00 |
0 |
0 |
|
TOTAL |
2 |
12:00 |
0 |
0 |
|
OVERALL |
6 |
36:00 |
1 |
0.03 |
Figure 2.9: Plots of First Sightings of All CWD Groups from Land-based Stations
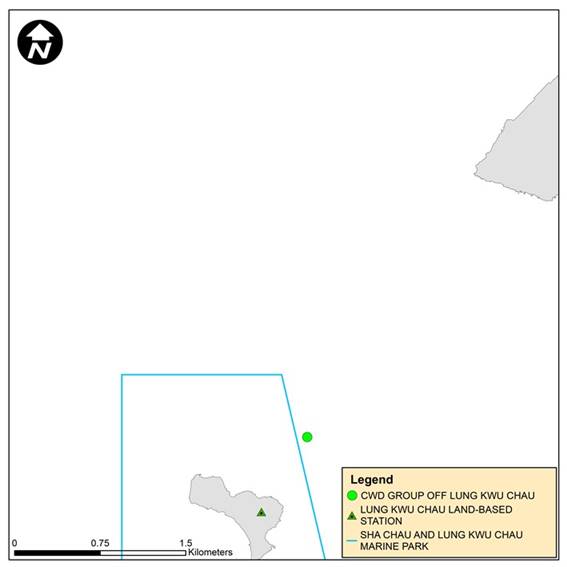
Remark: Marine park excludes land area and the landward boundary generally follows the high water mark along the coastline.
2.5.2.3
Progress Update
on PAM
PAM device has been deployed and positioned to the south of Sha Chau Island inside the SCLKCMP (Figure 2.10), supplement the detection of CWD presence in the south Sha Chau area that are not recorded visually by the land-based theodolite tracking survey and to coincide the theodolite data when there is sighting from the land-based station at Sha Chau. Both C-POD and F-POD are considered as effective PAM devices in detecting CWD occurrence, and F-POD was the main PAM device deployed where feasible. In this reporting period, the F-POD has been retrieved on 4 August 2021 for data collection and was subsequently re-deployed. As the period of data collection and analysis takes more than four months, PAM results could not be reported in quarterly intervals but report for supplementing the annual CWD monitoring analysis.
2.5.2.4
Site Audit for
CWD-related Mitigation Measures
During the reporting period, silt curtains were in place by the contractors for marine filling works and bored piling, in which dolphin observers were deployed by each contractor in accordance with the Marine Mammal Watching Plan (MMWP). Teams of at least two dolphin observers were deployed at 1 to 7 dolphin observation stations by the contractors for continuous monitoring of the DEZ by all contractors for seawall construction and bored piling works in accordance with the DEZ Plan. Trainings for the proposed dolphin observers on the implementation of MMWP and DEZ monitoring were provided by the ET prior to the aforementioned works, with a cumulative total of 704 individuals being trained and the training records were kept by the ET. From the contractors’ MMWP observation records and DEZ monitoring records, no dolphin or other marine mammals were observed within or around the silt curtains or the DEZ in this reporting period. The contractors’ records were also audited by the ET during site inspection.
Audits of acoustic decoupling for construction vessels were carried out during weekly site inspection and summarised in Section 2.7. Summary of audits of SkyPier HSFs route diversion and speed control and construction vessel management are presented in Section 2.8 and Section 2.9 respectively.
2.6
Sewage
Flow Monitoring
In accordance with the approved EIA Report (AEIAR-185/2014) for Expansion of Hong Kong International Airport into a Three-Runway System (3RS), the gravity sewer from the airport discharge manhole to TCSPS was recommended to be upgraded by AAHK to cater for the ultimate design sewage flow from the expanded airport. It was recommended in section 6.2.1.1 of the Manual that AAHK should conduct annual monitoring for the sewage flow build-up of the gravity sewer from the airport discharge manhole to TCSPS one year before the scheduled commencement of operation of the proposed third runway. The annual monitoring results shall inform the timing of commencement of the planning of the sewer upgrading works. The sewage flow monitoring methodology paper (the Paper) was prepared, submitted and subsequently approved by EPD on 21 June 2021.
2.6.1
Brief
Summary of the Agreed Method
With reference to the Paper, the existing sewer to be monitored is the section between FMH7042035 (reference point A) and FMH7043286 (reference point C). A schematic diagram of the sewage system between reference point A and C is presented in Figure 2.11. The locations of these reference points are presented in Figure 2.12. To determine if the threshold of 80% of the design capacity is being reached, an approach using the Colebrook-White equation was used.
Two pipe segments between reference points A and C were identified with the lowest flow capacity and therefore selected as the benchmark for comparing the actual sewage flow of the sewers for the flow monitoring:
● Segment 1: for sewage pipelines serving the airport – the critical segment is the 1050mm sewer between manholes FMH7042032 and FMH7042033, where the 80% threshold of full flow capacity is 53,395.2 m3/day; and
● Segment 2: for the sewage pipelines serving the airport and catchment L4 – the critical segment is the 1050mm sewer between manholes FMH7043288 and FMH7043287, where the of 80% threshold of full flow capacity is 57,628.8 m3/day.
According to the Paper, segment 1 would reach its 80% full flow capacity before segment 2. Hence, segment 1 was considered the critical segment within the section between reference points A and C, and it was agreed to conduct sewage flow monitoring for segment 1 only. With the daily flow rate of SPS-1, which collects sewage arising from the Airport, is available from AAHK, desk-based flow monitoring would be conducted by comparing the daily average flow rate of SPS-1 (i.e. Q1) against the threshold of 80% of pipe capacity of segment 1 (i.e. 53,395.2 m3/day) in accordance with the following criteria:
● If Q1 ≤ 53,395.2 m3/day, planning of sewerage upgrading works can be on hold until results of next annual monitoring; and
● If Q1 > 53,395.2 m3/day, planning of sewerage upgrading works shall be considered to start and annual monitoring shall be discontinued.
Within the monitoring period, if the daily average flow rate of SPS-1 (i.e. Q1) is higher than the threshold of 53,395.2 m3/day, planning of sewerage upgrading works shall be considered to start and the annual monitoring shall be discontinued. The above approach was agreed to be adopted as part of annual monitoring for the sewage flow increment of the concerned gravity sewer in 2021 and 2022.
2.6.2
Desk-Based
Monitoring Result
To fulfil the requirements as mentioned in previous section, the annual sewage flow monitoring has been started since June 2021. According to the daily flow monitoring record of SPS-1 from July to September 2021 (see Appendix C), the daily average flow of 13,989 m3/day for July 2021, 14,335 m3/day for August 2021 and 13,448 m3/day for September 2021 were well below the above-mentioned threshold of 53,395.2 m3/day. For the subsequent sets of sewage flow monitoring data for SPS-1, it will be presented in upcoming Quarterly and Annual EM&A Reports.
2.7
Environmental Site Inspection
Site inspections of the construction works were carried out on a weekly basis to monitor the implementation of proper environmental pollution control and mitigation measures for the Project. Bi-weekly site inspections were also conducted by the IEC. Besides, ad-hoc site inspections were conducted by ET and IEC if environmental problems were identified, or subsequent to receipt of an environmental complaint, or as part of the investigation work. These site inspections provided a direct means to reinforce the specified environmental protection requirements and pollution control measures in construction sites.
During site inspections, environmental situation, status of implementation of pollution control and mitigation measures were observed. Environmental documents and site records, including waste disposal record, maintenance record of environmental equipment, and relevant environmental permit and licences, were also checked on-site. Observations were recorded in the site inspection checklist and passed to the contractor together with the appropriate recommended mitigation measures where necessary in order to advise contractors on environmental improvement, awareness and on-site enhancement measures. The observations were made with reference to the following information during the site inspections:
· The EIA and EM&A requirements;
· Relevant environmental protection laws, guidelines, and practice notes;
· The EP conditions and other submissions under the EP;
· Monitoring results of EM&A programme;
· Works progress and programme;
· Proposal of individual works;
· Contract specifications on environmental protection; and
· Previous site inspection results.
Good site practices were implemented in the project to enhance environmental performance. Key examples implemented in the Project are highlighted as below:
1. Automated water sprinklers system with timers were installed and implemented within the construction site to suppress potential fugitive dust emission.
2. Solar lighting systems were installed at construction site to minimise energy consumption and provide safe and convenient lighting environment for workers and construction vehicular drivers.
3. Silt curtain was deployed in order to minimise potential water quality impact caused by the release of sediment plume during marine bored pilling works of the approach lights.
|
|
|
|
|
Use of automated water sprinklers with timers for dust suppression purpose |
Use of solar lighting systems for energy saving and lighting purpose |
Use of silt curtain for marine bored piling works of the approach lights |


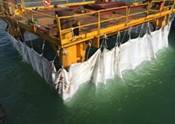
Besides, advice was given when necessary to ensure the construction workforce were familiar with relevant procedures, and to maintain good environmental performance on site. Regular toolbox talks on environmental issues were organised for the construction workforce by the contractors to ensure understanding and proper implementation of environmental protection and pollution control mitigation measures.
A summary of implementation status of the environmental mitigation measures for the construction phase of the Project during the reporting period is provided in Appendix B.
2.7.1
Landscape and Visual Mitigation Measures
Implementation of applicable landscape and visual mitigation measures (reference to the environmental protection measures CM1 – CM10 in Appendix B) is monitored regularly in accordance with the Manual. The implementation status of the environmental protection measures is summarised in Table 2.25. For trees which were managed under the Project during the reporting period, relevant measures have been implemented by Contracts 3302, 3503, 3508, 3602 and 3801. Contract 3802 would begin to undertake tree management measures subject to the handover of site area. Those trees which were within the Project boundary yet to be taken care by existing 3RS Contractors during the reporting period were managed by AAHK. The total number of retained trees, transplanted trees and to-be-transplanted trees under the management of Project are summarized in Table 2.26.
The total number of retained trees of the Project as of September 2021 was 89. Compared to 98 retained trees reported in the previous reporting period, the change in number was due to the following reasons:
· Some trees under Contract 3503 were confirmed not within their works area. Therefore, trees located in this area were removed from the retained tree list under the Project
(-11 nos);
· Some trees were added in works area under Contract 3801 (+3 nos) in August 2021; and
· A tree was handed over from Contract 3801 to Contract 3802 and was subsequently felled due to CLP ducting design in September 2021 (-1 nos).
Furthermore, a total of 79 nos. provisional trees under Contract 3508 were confirmed not within
their works area. Therefore, trees located in those areas were removed from the provisional retained tree list under the Project.
Table 2.25 lists the affected tree ID together with the reasons for change of retained tree status of the Project.
A total of seven trees under Contractor 3508 were transplanted to their corresponding receptor sites during the reporting period. Therefore, the cumulative total number of transplanted trees of the Project has been increased from 19 from previous reporting period to 26. The summary of transplanted trees is shown in Table 2.28. Photos of the transplanted trees are presented in Table 2.29 and the locations of newly transplanted trees during the reporting period are presented in Figure 2.13.
Table 2.25: Landscape and Visual – Construction Phase Audit Summary
|
Landscape and Visual Mitigation Measures during Construction Implementation Status |
Implementation Status |
Relevant Contract(s) in the Reporting Period |
|
CM1- The construction area and contractor’s temporary works areas shall be minimised to avoid impacts on adjacent landscape. |
The implementation of mitigation measures were checked by ET during weekly site inspection and clarified by the Contractors during the monthly Environmental Management Meetings. Implementation of the measures CM5, CM6 and CM7 by Contractors was observed. |
3RS Project contracts |
|
CM2 – Reduction of construction period to practical minimum. |
||
|
CM3 – Phasing of the construction stage to reduce visual impacts during the construction phase. |
||
|
CM4 – Construction traffic (land and sea) including construction plants, construction vessels and barges shall be kept to a practical minimum. |
||
|
CM5 – Erection of decorative mesh screens or construction hoardings around works areas in visually unobtrusive colours. |
||
|
CM6 – Avoidance of excessive height and bulk of site buildings and structures |
||
|
CM7 – Control of night-time lighting by hooding all lights and through minimisation of night working periods |
||
|
CM8 – All existing trees shall be carefully protected during construction. Detailed Tree Protection Specification shall be provided in the Contract Specification. Under this specification, the Contractor shall be required to submit, for approval, a detailed working method statement for the protection of trees prior to undertaking any works adjacent to all retained trees, including trees in contractor’s works areas |
Tree Protection Specifications have been provided in the relevant Contract Specifications respectively for implementation by the Contractors under the Project.
The Contractors’ performance on the implementation of the trees maintenance and protection measures were observed and checked by the ET weekly during construction period. |
3302, 3503, 3508, 3602, 3801
3802 (To be implemented) |
|
CM9 – Trees unavoidably affected by the works shall be transplanted where practical. A detailed Tree Transplanting Specification shall be provided in the Contract Specification, if applicable. Sufficient time for necessary tree root and crown preparation periods shall be allowed in the project programme |
Tree Transplanting Specifications have been provided in the relevant Contract Specifications respectively for implementation by the Contractors under the Project where trees will unavoidably be affected by the construction works.
The Contractors were required to submit Method Statements for tree transplanting prior to the transplanting works. Tree inspections were conducted by ET to check the tree transplanting works implemented by the Contractors on site.
The Contractors’ performance on the implementation of trees maintenance and protection measures on transplanted trees were observed and checked by the ET bi-monthly during the 12-month establishment period after the completion of each batch of transplanting works.
Long term management of the transplanted trees were currently monitored by ET annually. |
3503, 3508 3801
3802 (To be implemented) |
|
CM 10 – Land formation works shall be followed with advanced hydroseeding around taxiways and runways as soon as practical |
To be implemented around taxiways and runways as soon as practicable. |
To be implemented |
Table 2.26: Summary of the Number of Retained, Transplanted and To-be-transplanted Trees in the Reporting Period
|
Existing |
|
|
|
|
|
Contract |
Retain (nos.) |
Transplanted (nos.) |
To-be-transplanted (nos.) |
|
|
Establishment Period |
Maintenance Period |
|||
|
3302 |
9 |
0 |
0 |
0 |
|
3503 |
8 |
6 |
3 |
0 |
|
3508(1) |
25 |
12 |
0 |
0 |
|
3602 |
2 |
0 |
0 |
0 |
|
3801 |
45 |
0 |
5 (2) |
0 |
|
Sub-total |
89 |
18 |
8 |
0 |
|
Provisional |
|
|
|
|
|
Contract |
Retain (nos.) |
Transplanted (nos.) |
To-be-transplanted (nos.) |
|
|
3508(1) |
51 |
0 |
10 |
|
|
Sub-total |
51 |
0 |
10 |
|
|
Grand Total |
140 |
26 |
10 |
|
Note:
(1) As some of the site areas have been handed over to Contract 3508, Contractor of Contract 3508 is currently managing some of the trees. Existing trees to be managed by Contract 3508 is subject to change after initial tree surveys for each batch of site areas have been conducted by the Contractor.
(2) Three transplanted trees (CT1194, CT1794 and CT1795) were subsequently fell after transplantation. Please refer to for details.
Table 2.27: Summary of the Tree Status Updated in the Reporting Period
|
Tree ID(s) |
Contract
|
Previous Status (Jun 2021) |
Current Status (Sep 2021) |
Remarks |
Impact to Retain Tree Number |
|
T1252, T1253, T1254, T1255, T1256, T1257, T1258, T1259, T1260, T1278, T1280 |
3503 |
Retain |
Not within Project’s contract works area |
11 nos. of trees were confirmed not located within Project’s contract works area. |
- 11 nos. |
|
T4, T5, T6 |
3801 |
N/A |
Retain |
3 no. of trees were newly added in the works area of this contract. |
+ 3 nos. |
|
CT1888 |
3801 |
Retain |
Fell |
1 no. of tree was handed over from Contract 3801 to Contract 3802 and was subsequently felled due to CLP ducting design. |
- 1 no. |
Table 2.28: Summary of the Transplanted Trees Updated in the Reporting Period
|
Tree ID |
Transplant Date |
Management Stage |
Management Agency |
Remarks |
|
CT276 |
3 May 2018 |
Establishment period 4 May 2018 – May 2019 |
Contract 3801 |
Next inspection will be conducted in February 2022. Photos of the last inspection in February 2021 can be referred to Table 7.7 of Monthly EM&A Report No. 62. |
|
Long Term Management period Jun 2019 – May 2028 |
Southern Landside Petrol Filling Station |
|||
|
CT1253 |
4 May 2018 |
Establishment period 5 May 2018 – May 2019 |
Contract 3801 |
|
|
Long Term Management period Jun 2019 – May 2028 |
Southern Landside Petrol Filling Station |
|||
|
T835 |
22 Jan 2020 |
Establishment period 23 Jan 2020 – Jan 2021 |
Contract 3503
|
Next inspection will be conducted in February 2022. Photos of the last inspection in February 2021 can be referred to Table 7.7 of Monthly EM&A Report No. 62. |
|
Long Term Management period Feb 2021 – Jan 2030 |
||||
|
T836 |
13 Dec 2019 |
Establishment period 14 Dec 2020 – Jan 2021 |
||
|
Long Term Management period Feb 2021 – Jan 2030 |
||||
|
T838 |
22 Jan 2020 |
Establishment period 23 Jan 2020 – Jan 2021 |
||
|
Long Term Management period Feb 2021 – Jan 2030 |
||||
|
T812 |
21 Dec 2020 |
Establishment period 22 Dec 2020 – Dec 2021 |
Contract 3503
|
Next inspection will be conducted in October 2021. Photos of the last inspection in August 2021 were shown in Table 2.29. |
|
T814 |
20 Dec 2020 |
Establishment period 21 Dec 2020 – Dec 2021 |
||
|
T815 |
15 Dec 2020 |
Establishment period 16 Dec 2020 – Dec 2021 |
||
|
T829 |
18 Dec 2020 |
Establishment period 19 Dec 2020 – Dec 2021 |
||
|
T830 |
14 Dec 2020 |
Establishment period 15 Dec 2020 – Dec 2021 |
||
|
T831 |
19 Dec 2020 |
Establishment period 20 Dec 2020 – Dec 2021 |
||
|
T1493 |
6 Jul 2021 |
Establishment period 7 Jul 2021 – Jul 2022 |
Contract 3508
|
Next inspection will be conducted in October 2021. Photos of the last inspection in September 2021 were shown in Table 2.29. |
|
T1494 |
6 Jul 2021 |
Establishment period 7 Jul 2021 – Jul 2022 |
||
|
T1495 |
10 Jul 2021 |
Establishment period 11 Jul 2021 – Jul 2022
|
||
|
T1496 |
5 Jul 2021 |
Establishment period 6 Jul 2021 – Jul 2022 |
||
|
T1497 |
5 Jul 2021 |
Establishment period 6 Jul 2021 – Jul 2022 |
||
|
T1498 |
29 Jun 2021 |
Establishment period 30 Jun 2021 – Jul 2022 |
||
|
T1499 |
29 Jun 2021 |
Establishment period 30 Jun 2021 – Jul 2022 |
||
|
T1500 |
30 Jun 2021 |
Establishment period 1 Jul 2021 – Jul 2022 |
||
|
T1501 |
30 Jun 2021 |
Establishment period 1 Jul 2021 – Jul 2022 |
||
|
T1502 |
5 Jul 2021 |
Establishment period 6 Jul 2021 – Jul 2022 |
||
|
T1503 |
6 Jul 2021 |
Establishment period 7 Jul 2021 – Jul 2022 |
||
|
T1504 |
24 Jun 2021 |
Establishment period 25 Jun 2021 – Jul 2022 |
||
|
CT1194 |
4 May 2018 |
Establishment period 5 May 2018 – May 2019 |
Contract 3801 |
NA |
|
Long Term Management period Jun 2019 – May 2028 |
Southern Landside Petrol Filling Station |
Uprooted and collapsed due to Typhoon Higos on 18 August 2020. Tree removal was conducted as recommended by tree specialist of the contractor of Southern Landside Petrol Filing Station.
|
||
|
CT1794 |
3 May 2018 |
Establishment period 4 May 2018 – May 2019 |
Contract 3801 |
NA |
|
Long Term Management period Jun 2019 – May 2028 |
AsiaWorld-Expo |
The tree within the land parcel was acquired by the government for construction of emergency hospital to handle COVID19 pandemic at AsiaWorld-Expo. The tree was felled in late 2020. |
||
|
CT1795 |
3 May 2018 |
Establishment period 4 May 2018 – May 2019 |
Contract 3801 |
NA |
|
Long Term Management period Jun 2019 – May 2028 |
AsiaWorld-Expo |
The tree within the land parcel was acquired by the government for construction of emergency hospital to handle COVID19 pandemic at AsiaWorld-Expo. The tree was felled in late 2020. |
Table 2.29: Photos of the Existing Transplanted Trees in the Reporting Period
|
Under 12-month Establishment Period: |
|||
|
|
|
|
|
|
T812 |
T814 |
T815 |
|
|
|
|
|
|
|
T829 |
T830 |
T831 |
|
|
|
|
|
|
|
T1498 |
T1499 |
T1500 |
|
|
|
|
|
|
|
T1501 |
T1504 |
|
|
|
Newly Transplanted Trees during the Reporting Period |
|||
|
|
|
|
|
|
T1493 |
T1494 |
T1495 |
|
|
|
|
|
|
|
T1496 |
T1497 |
T1502 |
|
|
|
|
||
|
T1503 |
|
||
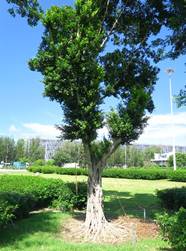
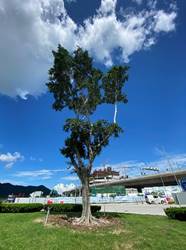
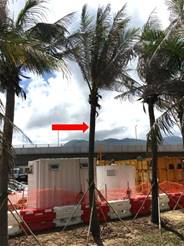
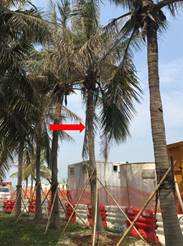
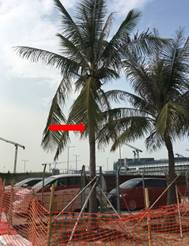
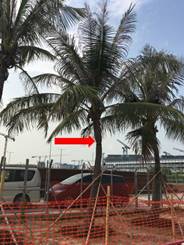
2.7.2
Land Contamination Assessment
The Supplementary CAP was submitted to EPD pursuant to EP Condition 2.20. The CARs for Golf Course and T2 Emergency Power Supply Systems (EPSS) were submitted to EPD in accordance with EP Condition 1.9 and the Supplementary CAP in which no land contamination issues were identified. EPD has issued no further comment for aforesaid CARs. No leakage was found after the removal of underground fuel pipelines and all required additional photos have been submitted to EPD.
According to the approved supplementary CAP, there are 3 remaining locations where site re-appraisal / additional site investigation are proposed. Based on the latest construction information, which has been presented in Appendix A Implementation Schedule of the approved CARs for T2 EPSS, there is no development programme for these locations at this stage. As such, the status of site re-appraisal/ additional site investigation will be further updated upon latest development programme is available.
2.8
Audit of SkyPier High Speed
Ferries
The Marine Travel Routes and Management Plan for High Speed Ferries of SkyPier (the SkyPier Plan) was submitted to the Advisory Council on the Environment for comment and subsequently submitted to and approved by EPD in November 2015 under EP Condition 2.10. The approved SkyPier Plan is available on the dedicated website of the Project. In the SkyPier Plan, AAHK has committed to implement the mitigation measure of requiring HSFs of SkyPier travelling between HKIA and Zhuhai / Macau to start diverting the route with associated speed control across the area, i.e. Speed Control Zone (SCZ), with high CWD abundance. The route diversion and speed restriction at the SCZ have been implemented since 28 December 2015.
Due to the COVID-19 pandemic, all SkyPier HSF services to/from Zhuhai and Macau have been suspended from 25 March 2020 until further notice. Limited HSF services from other destination, which does not require the use of the diverted route, were provided starting from 28 October 2020.
No ferry movement between HKIA SkyPier to/from Zhuhai and Macau was recorded in the reporting period. The daily movements of all SkyPier HSFs in the reporting period, including those not using the diverted route, ranged between 2 and 11, which fell within the maximum daily cap number of 125.
As updated by CLP Power, the construction works of the Hong Kong Offshore LNG Terminal Project may affect the route diversion operation of the SkyPier HSFs from Q3 to Q4 2021. The captains were informed on the issue and ET will continue to closely monitor the implementation of the SkyPier Plan in the period.
2.9
Audit of Construction and Associated Vessels
On the implementation of the updated Marine Travel Routes and Management Plan for Construction and Associated Vessels (MTRMP-CAV), the Maritime Surveillance System (MSS) automatically recorded deviation cases such as speeding, entering no entry zone, and not traveling through the designated gates. ET conducted bi-weekly audit of relevant information including AIS data, vessel tracks and other relevant records to ensure sufficient information were provided by the system and the contractors complied with the requirements of the MTRMP-CAV. The contactors submitted 3-month rolling vessel plans for construction vessel activities to AAHK in order to help maintain the number of construction vessels to a practicable minimum. The IEC also performed audit on the compliance of the requirements as part of the EM&A programme.
During the reporting period, deviations including speeding within the works area, entry from non-designated gates, and entering no-entry zones were identified. After investigation by the contractor’s Construction Traffic Control Centre (CTCC) representatives, all the concerned captains were reminded to comply with the requirements of the MTRMP-CAV.
A total of 4 skipper training workshops were held by ET during the reporting period and 10 concerned captains of construction vessels associated with the 3RS contracts were trained to familiarise them with the predefined routes, general education on local cetaceans, guidelines for avoiding adverse water quality impact, the required environmental practices / measures while operating construction and associated vessels under the Project, and guidelines for operating vessels safely in the presence of CWDs. Another 9 skipper training workshops were held with 16 captains by contractors’ Environmental Officers and competency tests were conducted subsequently with the trained captains by ET.
2.10
Review of the Key Assumptions Adopted in the EIA Report
With reference to Appendix E of the Manual, it is noted that the key assumptions adopted in approved EIA report for the construction phase are still valid and no major changes are involved. The environmental mitigation measures recommended in the approved EIA Report remain applicable and shall be implemented in undertaking construction works for the Project.
3
Report on Non-compliance,
Complaints, Notifications of Summons and Prosecutions
3.1
Compliance with Other Statutory Environmental Requirements
During the reporting period, environmental related licenses and permits required for the construction activities were checked. No non-compliance with environmental statutory requirements was recorded.
3.2
Analysis and Interpretation of Complaints, Notification of
Summons and Status of Prosecutions
3.2.1
Complaints
One environmental complaint was received during the reporting period. All environmental complaint was attended to and investigation was conducted by the ET in accordance with the Manual and the Complaint Management Plan. The summary of the complaint and analysis is presented in Table 3.1.
Table 3.1: Summary of Environmental Complaints
|
Date of Complaint Received |
Details |
Analysis/ Remedial Actions |
Status |
|
13 Jul 2021 |
A complaint regarding dust issue at 3RS construction site area was received on 13 July 2021. |
For the complaint received on 13 July 2021 regarding dust issue at 3RS construction site area, the case was investigated by ET in accordance with the Manual and the Complaint Management Plan of the Project. The ET recognized the concerned location and identified one related contractor and requested them to provide information regarding the complaint. Based on the information provided by the contractor, lifting and concreting works were carried out at the concerned location during the concerned period in which watering of vehicular accesses, following the circuits as set out in contractor’s dust control management plan, had been arranged. The contractor also provided water spraying record for their fleet of working watering trucks from 1 to 14 July 2021.
Based on ET’s weekly site inspections, dust generation from the vehicular movement was observed on 6 July 2021, and the related contractor subsequently followed up issue by implementing water spraying on the concerned location. Haul road was appeared slightly dry even though water spraying was observed in progress during the weekly site inspection on 13 July 2021 and the related contractor was advised to provide adequate dust suppression measures to keep haul road in a damp condition. The contractor committed to enhance their fleet by adding one more water truck and stated that they would provide refresher training for their water truck drivers to refresh them on the arrangement of water spraying on haul road and stockpiles. Eventually, ET observed the related contractor was conducting water spraying in concerned location during the weekly site inspection on 22 July 2021 and no dust issue was observed at the concerned location during ad-hoc inspections on 10 and 16 July 2021. The dust mitigation performance was also improved after the enhancement during weekly site inspections on 3, 9 and 17 August 2021. It was worth noting that Hong Kong Observatory recorded a maximum of 35.1°C on 13 July 2021 in which the hot and sunny conditions might increase the evaporation rate of water that was sprayed, leading to haul road and stockpiles drying up quickly. Nevertheless, all air quality monitoring results from 1 to 14 July 2021 were within the corresponding Action and Limit Levels. ET reminded the related contractor to continue implementing their environmental mitigation measures regarding dust control on their haul road and stockpiles especially on sunny days. Hence, the complaint case was considered closed. |
Closed |
3.2.2
Notifications of Summons or Status of Prosecution
No notification of summons nor prosecution was received during the reporting period.
3.3
Cumulative
Statistics
Cumulative statistics on valid exceedance, non-compliance, complaints, notifications of summons and status of prosecutions are summarised in Table 3.2 and Table 3.3.
Table 3.2: Statistics for Valid Exceedances for the Environmental Monitoring
|
|
|
Total No. Recorded in the Reporting Period |
Total No. Recorded since the Project Commenced |
|
1-hr TSP |
Action Level |
0 |
0 |
|
|
Limit Level |
0 |
0 |
|
Noise |
Action Level |
0 |
0 |
|
|
Limit Level |
0 |
0 |
|
Waste |
Action Level |
0 |
0 |
|
|
Limit Level |
0 |
0 |
|
Water |
Action Level |
0 |
0 |
|
|
Limit Level |
0 |
0 |
|
CWD |
Action Level |
0 |
0 |
|
|
Limit Level |
0 |
0 |
Remark: Non-project related triggers of Action or Limit Level are not shown in this table.
Table 3.3: Statistics for Non-compliance, Complaints, Notifications of Summons and Prosecution
|
Reporting Period |
Cumulative Statistics |
|||
|
|
Non-compliance |
Complaints |
Notifications of Summons |
Prosecutions |
|
This reporting period |
0 |
1 |
0 |
0 |
|
From 28 December 2015 to end of the reporting period |
0 |
40 |
1 |
1 |
4
Conclusion and Recommendation
In this quarterly period from 1 July 2021 to 30 September 2021, the EM&A programme has been implemented as planned, including 90 sets of air quality measurements, 54 sets of construction noise measurements, 39 sets of water quality measurements, 6 complete sets of vessel line transect surveys and 6 days of land-based theodolite tracking survey effort for CWD monitoring, as well as environmental site inspections and waste monitoring for the Project’s construction works.
The key activities of the Project carried out in the reporting period included reclamation works and land-based works. Works in the reclamation areas included marine filling, seawall, site office and facilities construction, together with runway and associated works such as bored piling for approach lights. Land-based works on existing airport island involved mainly airfield works, foundation and substructure work for Terminal 2 expansion, modification and tunnel work for APM and BHS, and preparation work for utilities, with activities include site establishment, road and drainage works, cable ducting, demolition, piling, and excavation works.
Monitoring results of construction dust, construction noise, construction waste, and CWD monitoring did not trigger the corresponding Action and Limit Levels during the reporting period.
All site observations made by the ET were recorded in the site inspection checklists and passed to the contractor together with the recommended follow-up actions.
For water quality, the water quality monitoring results for all parameters, except DO and SS, obtained during the reporting period were within the corresponding Action and Limit Levels stipulated in the EM&A programme. Relevant investigation and follow-up actions will be conducted according to the EM&A programme if the corresponding Action and Limit Levels are triggered. For DO and SS, some testing results triggered the relevant Action or Limit Levels, and the corresponding investigations were conducted accordingly. The investigation findings concluded that the cases were not related to the Project. In summary, the construction activities undertaken during the reporting period did not introduce adverse impact to all water quality sensitive receivers.
No HSF movement between HKIA SkyPier to/from Zhuhai and Macau was recorded during the reporting period. Therefore, no deviation was recorded in the HSF monitoring during the reporting period.
During the reporting period, ET conducted bi-weekly audit of the MSS to ensure the system recorded all deviation cases accurately and the contractors fully complied with the requirements of the MTRMP-CAV. 4 skipper training workshops were held by ET and 9 skipper training workshops were held by contractors’ Environmental Officers during the reporting period and competency tests were conducted subsequently with the trained skippers by ET.
On the implementation of MMWP, dolphin observers were deployed by the contractors for laying of silt curtains for marine filling works in accordance with the plan. On the implementation of DEZ Plan, dolphin observers were deployed for continuous monitoring of the DEZ by the contractors for seawall construction works in accordance with the DEZ Plan. Trainings for the proposed dolphin observers were provided by the ET prior to the aforementioned works. From the contractors’ MMWP observation records and DEZ monitoring records, no dolphin or other marine mammals were observed within or around the silt curtains or the DEZ in this reporting period. Audits of acoustic decoupling for construction vessels were also carried out by the ET.
The recommended environmental mitigation measures, as included in the EM&A programme, were effectively implemented during the reporting period. Also, the EM&A programme implemented by the ET has effectively monitored the construction activities and ensured the proper implementation of mitigation measures.
[1]
The Manual is available on the Project’s dedicated website (accessible at: http://env.threerunwaysystem.com/en/index.html)